Example 415: 3D Surface with 4th Dimension WData
Pe3do3D Scientific Objectadvanced
4th Dimension WData
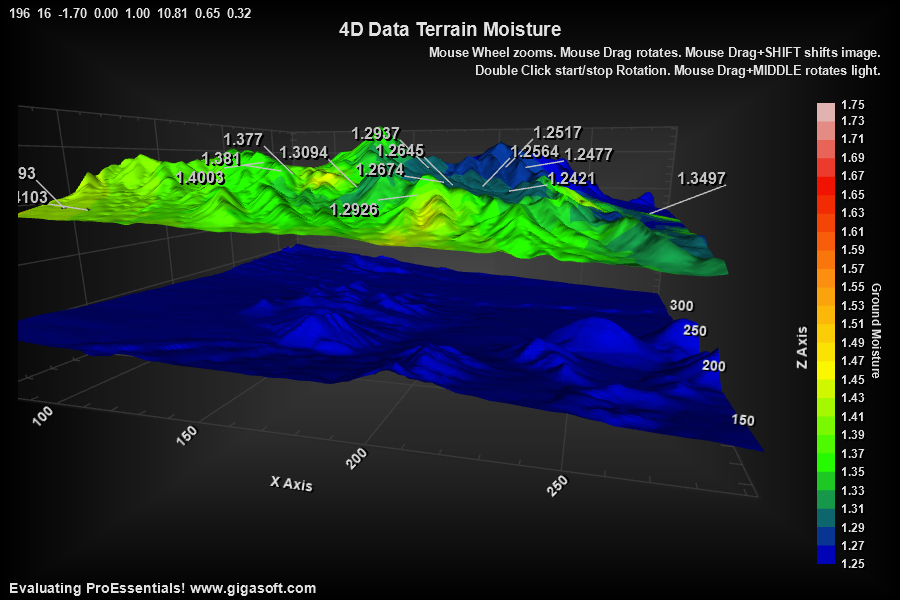
Form6.cs
1//2// re-click 415 to demo random surfaces with random 4th dimension controlling color3 4int nRndR = (int)(Rand_Num.NextDouble() * 150.0F);5int nRndC = (int)(Rand_Num.NextDouble() * 150.0F);6 7int Row, Col;8int nStartRow = 0 + nRndR;9int nEndRow = 200 + nRndR;10int nTargetRows = nEndRow - nStartRow + 1;11 12int nStartCol = 0 + nRndC;13int nEndCol = 200 + nRndC;14int nTargetCols = nEndCol - nStartCol + 1;15int nQ = nTargetRows * nTargetCols;16 17Int32[] pElevData = new Int32[2250000];18String filepath;19filepath = System.AppDomain.CurrentDomain.BaseDirectory + "\\terrain2.bin";20System.IO.FileStream fs = new System.IO.FileStream(filepath, System.IO.FileMode.Open);21System.IO.BinaryReader r = new System.IO.BinaryReader(fs);22 23bool foundtargetindex = false;24int o;25for (o = 0; o < 2250000; o++)26 pElevData[o] = r.ReadInt32();27fs.Close();28 29float[] pMyXData = new float[nQ];30float[] pMyYData = new float[nQ];31float[] pMyZData = new float[nQ];32float[] pMyWData = new float[nQ];33 34int rowcounter = 0;35int colcounter = 0;36for (Row = 0; Row < 1500; Row++)37{38 for (Col = 0; Col < 1500; Col++)39 {40 foundtargetindex = false;41 if (Row >= nStartRow && Row <= nEndRow)42 {43 if (Col >= nStartCol && Col <= nEndCol)44 {45 foundtargetindex = true;46 o = (rowcounter * nTargetRows) + colcounter;47 pMyXData[o] = Col + 1;48 pMyZData[o] = Row + 1;49 pMyYData[o] = (float)(pElevData[(Row * 1500) + Col] * 0.1); // controls height of surface50 // Get WData from a different section of terrain file and scale it differently to simulate random data51 pMyWData[o] = (float)(pElevData[((Row + 225) * 1500) + Col] * 0.0001); // controls contour color of surface52 // There is no property that turns on WData processing, setting WData uses WData. Use WData.Clear() to revert to 3D.53 }54 }55 if (foundtargetindex) { colcounter = colcounter + 1; }56 }57 if (foundtargetindex) { rowcounter = rowcounter + 1; }58}59 60Pe3do1.PeData.Subsets = nTargetRows;61Pe3do1.PeData.Points = nTargetCols;62 63// Perform the transfer of data //64Pe3do1.PeData.X.FastCopyFrom(pMyXData, nQ);65Pe3do1.PeData.Y.FastCopyFrom(pMyYData, nQ);66Pe3do1.PeData.Z.FastCopyFrom(pMyZData, nQ);67Pe3do1.PeData.W.FastCopyFrom(pMyWData, nQ); // WData provides for 4D data 4D Surface68 69Pe3do1.PeLegend.Location = LegendLocation.Right;70Pe3do1.PeLegend.ContourStyle = true;71 72Pe3do1.PeColor.ContourColorBlends = 5;73Pe3do1.PeColor.ContourColorSet = ContourColorSet.BlueGreenYellowOrangeRed;74Pe3do1.PeLegend.ContourLegendPrecision = ContourLegendPrecision.TwoDecimals;75 76Pe3do1.PeString.ContourLegendTitle = "Ground Moisture";77 78// Without manually scaling, this chart determines WData is roughly 1.3 to 1.779// This controls scale of legend and matching colors in contour80Pe3do1.PeGrid.Configure.ManualScaleControlW = ManualScaleControl.MinMax;81Pe3do1.PeGrid.Configure.ManualMinW = 1.25;82Pe3do1.PeGrid.Configure.ManualMaxW = 1.75;83 84// Enable smooth rotating and zooming //85Pe3do1.PeUserInterface.Scrollbar.ScrollSmoothness = 3;86Pe3do1.PeUserInterface.Scrollbar.MouseWheelZoomSmoothness = 3;87Pe3do1.PeUserInterface.Scrollbar.PinchZoomSmoothness = 3;88 89// Enable DegreePrompting, to view rotation, zoom, light location to aid90// in determining different default values for such properties //91Pe3do1.PePlot.Option.DegreePrompting = true;92 93// Enable button dragging //94Pe3do1.PeUserInterface.Scrollbar.MouseDraggingX = true;95Pe3do1.PeUserInterface.Scrollbar.MouseDraggingY = true;96 97// Set view98Pe3do1.PeUserInterface.Scrollbar.ViewingHeight = 16;99Pe3do1.PeUserInterface.Scrollbar.DegreeOfRotation = 196;100 101Pe3do1.PePlot.Option.DxZoomMax = 3F; // v10 New properties to control max and min mousewheel zoom102Pe3do1.PePlot.Option.DxZoomMin = -5F;103 104Pe3do1.PePlot.Option.DxViewportPanFactor = 2.0F; // v10 New properties to control shift/drag and mousewheel sensitivity105Pe3do1.PeUserInterface.Scrollbar.MouseWheelZoomFactor = 3.75F;106 107// Set a light location //108Pe3do1.PeFunction.SetLight(0, 10.0F, .6F, .3F);109 110// Set eye/camera distance, or Zoom amount //111Pe3do1.PePlot.Option.DxZoom = -1.70F;112Pe3do1.PePlot.Option.DxFitControlShape = false;113Pe3do1.PeGrid.Option.GridAspectX = 2.5F;114Pe3do1.PeGrid.Option.GridAspectZ = 2.5F;115Pe3do1.PePlot.Option.DxViewportY = 1.0F;116 117// Mechanism to control polygon border color //118Pe3do1.PeColor.SubsetColors[(int)(SurfaceColors.WireFrame)] = Color.FromArgb(255, 165, 165, 165);119Pe3do1.PeColor.SubsetColors[(int)(SurfaceColors.SolidSurface)] = Color.FromArgb(255, 159, 159, 159);120 121// Set the plotting method //122//! There are different plotting method values for each //123//! case of PolyMode //124Pe3do1.PePlot.Method = ThreeDGraphPlottingMethod.Four; ////.///.Zero;125Pe3do1.PePlot.Allow.SurfaceContour = true;126 127// Set various other properties //128Pe3do1.PeString.MainTitle = "4D Data Terrain Moisture";129 130Pe3do1.PeConfigure.RenderEngine = RenderEngine.Direct3D;131Pe3do1.PeString.SubTitle = "||Mouse Wheel zooms. Mouse Drag rotates. Mouse Drag+SHIFT shifts image. ";132Pe3do1.PeString.MultiSubTitles[0] = "||Double Click start/stop Rotation. Mouse Drag+MIDDLE rotates light. ";133 134Pe3do1.PeColor.BitmapGradientMode = true;135Pe3do1.PeColor.QuickStyle = QuickStyle.DarkNoBorder;136 137// Add some padding around chart for prettiness if using inset or shadow borders138Pe3do1.PeConfigure.ImageAdjustLeft = 100;139Pe3do1.PeConfigure.ImageAdjustRight = 100;140Pe3do1.PeConfigure.ImageAdjustTop = 100;141Pe3do1.PeConfigure.ImageAdjustBottom = 100;142 143Pe3do1.PeFont.Fixed = true;145Pe3do1.PeConfigure.PrepareImages = true;146Pe3do1.PeConfigure.CacheBmp = true;147 148Pe3do1.PeConfigure.TextShadows = TextShadows.BoldText;149Pe3do1.PeFont.Label.Bold = true;150 151// Set various export defaults //152Pe3do1.PeSpecial.DpiX = 600;153Pe3do1.PeSpecial.DpiY = 600;154 155// default export setting //156Pe3do1.PeUserInterface.Dialog.ExportSizeDef = ExportSizeDef.NoSizeOrPixel;157Pe3do1.PeUserInterface.Dialog.ExportTypeDef = ExportTypeDef.Png;158Pe3do1.PeUserInterface.Dialog.ExportDestDef = ExportDestDef.Clipboard;159Pe3do1.PeUserInterface.Dialog.ExportUnitXDef = "1280";160Pe3do1.PeUserInterface.Dialog.ExportUnitYDef = "768";161Pe3do1.PeUserInterface.Dialog.ExportImageDpi = 300;162Pe3do1.PeUserInterface.Dialog.AllowEmfExport = false;163Pe3do1.PeUserInterface.Dialog.AllowWmfExport = false;164 165Pe3do1.PeConfigure.AntiAliasGraphics = true;166Pe3do1.PeConfigure.AntiAliasText = true;167 168// Enable CursorPromptTracking HighlighColor, etc only applicable to Direct3D RenderEngine169Pe3do1.PeUserInterface.HotSpot.Data = true;170Pe3do1.PeUserInterface.Cursor.PromptTracking = true;171Pe3do1.PeUserInterface.Cursor.PromptStyle = CursorPromptStyle.YValue; // TrackingCustomDataText overrides172Pe3do1.PeData.Precision = DataPrecision.TwoDecimals;173Pe3do1.PeUserInterface.Cursor.HighlightColor = Color.FromArgb(255, 255, 0, 0);174Pe3do1.PeUserInterface.Cursor.TrackingCustomDataText = true;175Pe3do1.PeUserInterface.Cursor.TrackingTooltipMaxWidth = 200;176 177 178Pe3do1.PePlot.Option.ShowContour = ShowContour.None; //.BottomColors;179Pe3do1.PeUserInterface.Menu.DataShadow = MenuControl.Show;180Pe3do1.PeUserInterface.Menu.LegendLocation = MenuControl.Show;181Pe3do1.PeUserInterface.Menu.Rotation = MenuControl.Hide;182Pe3do1.PeUserInterface.Menu.AnnotationControl = true;183Pe3do1.PeUserInterface.Menu.ShowAnnotationText = MenuControl.Show;184Pe3do1.PeUserInterface.Menu.AnnotationTextFixedSize = MenuControl.Show;185 186// Add some random graph annotations //187int aCnt = 0;188for (int annot = 0; annot < 15; annot++)189{190 int nRndRow = (int)(Rand_Num.NextDouble() * (float)nTargetRows - 1);191 int nRndCol = (int)(Rand_Num.NextDouble() * (float)nTargetCols - 1);192 Pe3do1.PeAnnotation.Graph.X[aCnt] = nStartCol + nRndCol + 1;193 Pe3do1.PeAnnotation.Graph.Z[aCnt] = nStartRow + nRndRow + 1;195 Pe3do1.PeAnnotation.Graph.Type[aCnt] = (int)Gigasoft.ProEssentials.Enums.GraphAnnotationType.DiamondSolid;196 Pe3do1.PeAnnotation.Graph.Text[aCnt] = "";197 Pe3do1.PeAnnotation.Graph.Color[aCnt] = Color.FromArgb(255, 94, 94, 94);198 MainWindow.m_nAnnotationStartIndices[annot] = aCnt;199 aCnt++;200 Pe3do1.PeAnnotation.Graph.X[aCnt] = nStartCol + nRndCol + 1;201 Pe3do1.PeAnnotation.Graph.Z[aCnt] = nStartRow + nRndRow + 1;203 Pe3do1.PeAnnotation.Graph.Type[aCnt] = (int)Gigasoft.ProEssentials.Enums.GraphAnnotationType.Pointer;204 // Read WData to use as annotation text //206 Pe3do1.PeAnnotation.Graph.Color[aCnt] = Color.FromArgb(255, 194, 194, 194);207 aCnt++;208}209Pe3do1.PeAnnotation.Show = true;210Pe3do1.PeAnnotation.Graph.Show = true;211Pe3do1.PeAnnotation.Graph.LeftJustificationOutside = true;212Pe3do1.PeAnnotation.Graph.SymbolObstacles = true;213Pe3do1.PeFont.GraphAnnotationTextSize = 110;214Pe3do1.PeUserInterface.HotSpot.GraphAnnotation = false;215 216// GraphAnnotTriangleData : lay an extra surface BELOW the normal surface.217// The CreatePolyData helper emits TriangleData (tris, like 406) and we push it218// through the ComputeShader-compatible GraphAnnotTriangleData property.219Gigasoft.ProEssentials.Structs.TriangleData[] extra2d;220extra2d = CreatePolyData(pMyWData, nTargetRows, nTargetCols, -25.0F, 25.0F, -25.0F, 25.0F, -10.0F, -5.0F);221// We use -25 to 25 because above code is using GridAspectX GridAspectZ = 2.5, the default logical coordinates would be -10 to 10222// We use -10 to -5 to normalize the surface annotation to the bottom quarter of scale.223 224// pass the list of triangles via the GraphAnnotTriangleData property and PEvset225Gigasoft.ProEssentials.Api.PEvsetW(Pe3do1.PeSpecial.HObject, DllProperties.GraphAnnotTriangleData, extra2d, extra2d.Length);226 227Pe3do1.PeAnnotation.Graph.GraphAnnotPolyDataPlotMethod = GraphAnnotPolyDataPlotMethod.PolygonColor;228 229Pe3do1.PeGrid.Configure.ManualScaleControlY = ManualScaleControl.Min; // Add some space on bottom of chart by adjusting min of y axis230Pe3do1.PeGrid.Configure.ManualMinY = 750; // We know the general range of data, so we simply hard coded this value to allow for 25% more space on bottom231 232// Note RenderEngine must be set before enabling ComputeShader //233Pe3do1.PeConfigure.RenderEngine = RenderEngine.Direct3D;234Pe3do1.PeData.ComputeShader = true; // TriangleData enables ComputeShader rendering235 236Pe3do1.PeFunction.Force3dxVerticeRebuild = true;237Pe3do1.PeFunction.Force3dxAnnotVerticeRebuild = true;238Pe3do1.PeFunction.Force3dxAnnotPolyDataVerticeRebuild = true;239 240Pe3do1.PeFunction.ReinitializeResetImage();241Pe3do1.Invalidate();242Pe3do1.Refresh();Tip: Uses property syntax like
Pego1.PeData.Y[s, p]Click underlined properties to view documentation