Live JavaScript charting demo with popup menus, dialogs and source code
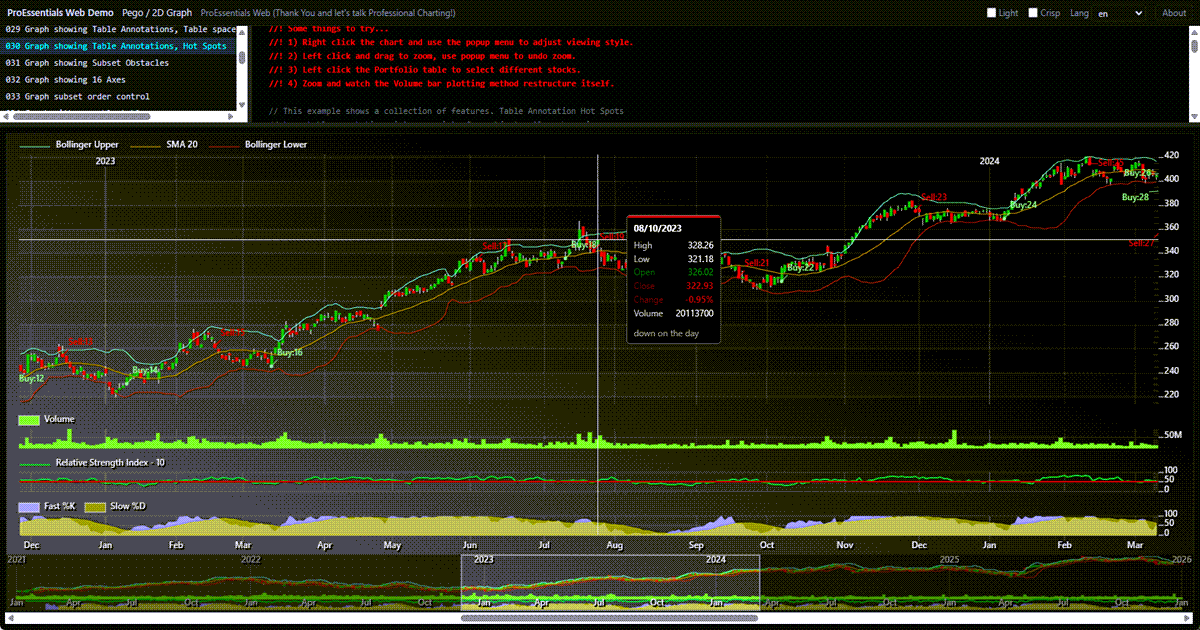
This is the ProEssentials charting engine compiled to WebAssembly and running in the browser. Every chart on this page is drawn by the same C++ engine that powers the WinForms, WPF and WinUI editions, so a JavaScript chart here and a desktop chart in a .NET application come out of one codebase rather than two lookalike implementations.
Pick any of the 114 examples in the list and it builds immediately, with its full source beside it. The examples cover 2D graphs, scientific graphs, pie and polar charts, and 3D surfaces rendered through WebGPU: real-time streaming data, millions of points per subset, date-time axes, financial candlesticks, contour and heatmap surfaces, annotations, hot spots and custom axis formatting.
Right-click any chart for the built-in popup menu, and open the export, customize, font and titles dialogs from it. Those come from the engine, not from this page, so a customer gets them by including the library rather than by building them. The language selector switches the menu, the dialogs and the built-in date-time and number formatting through twenty bundled cultures.
The whole demo is two script tags: one classic tag for the runtime bundle and one module tag for the application. TypeScript declarations ship beside it, so an editor offers the API with no configuration. The source for this demo is on GitHub, and ProEssentials is free for commercial use by organizations under USD 250,000 annual revenue.
This demo is on GitHub: proessentials-js-demo. Clone it and run npm start.