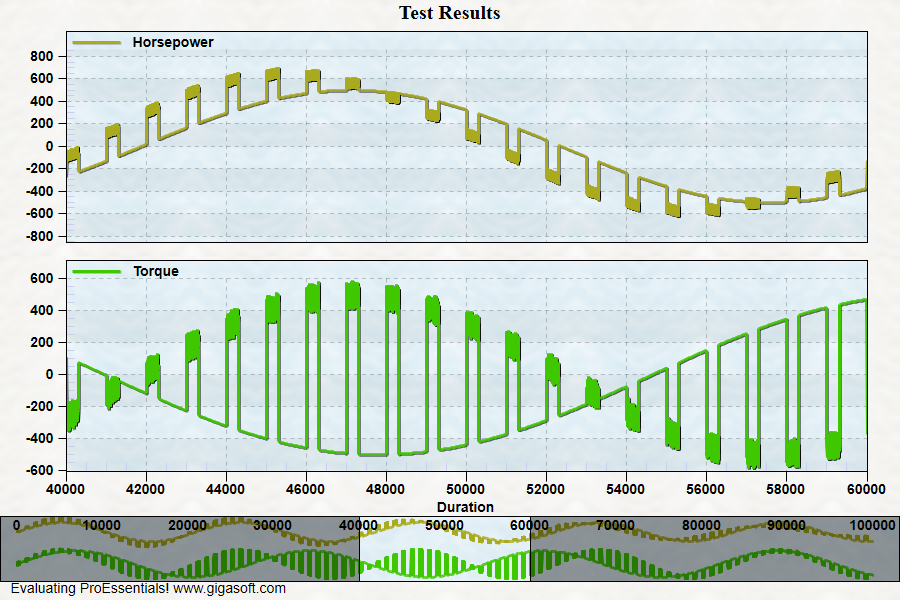
Example 124: Scientific Graph showing programmatic horizontal zooming
PesgoScientific Graph Objectintermediate
Programmatic horizontal zooming
Form3.cs
1// This example builds upon the basic CreateSimpleSGraph '100' example chart //2CreateSimpleSGraph(Pesgo1);3 4//! Zoom logic here. It's important that if using MultiAxesSubsets //5//! that AllowZooming is set to PEAZ_HORIZONTAL to programmatically zoom. //6Pesgo1.PeUserInterface.Allow.Zooming = AllowZooming.Horizontal;7Pesgo1.PeUserInterface.Scrollbar.ScrollingHorzZoom = true;8 9// Select desired zoom extents and enable zoomed mode //10Pesgo1.PeGrid.Zoom.MinX = 40000;11Pesgo1.PeGrid.Zoom.MaxX = 60000;12Pesgo1.PeGrid.Zoom.Mode = true;13 14// Re-pass the data, adding more data //15Pesgo1.PeData.Subsets = 2;16Pesgo1.PeData.Points = 100000;17 18// Prepare data in temp arrays19float[] MyYData = new float[200000];20float[] MyXData = new float[200000];21int k, j;22for (j = 0; j <= 99999; j++)23{24 MyXData[j] = j + 1;25 MyYData[j] = Convert.ToInt32(Math.Sin(0.0003 * j) * 500);26 MyXData[100000 + j] = j + 1;27 MyYData[100000 + j] = Convert.ToInt32(Math.Sin(0.00023 * j) * 500);28 29}30// Change some of the data so we can see some variations in data31for (j = 0; j <= 99000; j = j + 1000)32{33 for (k = 0; k <= 300; k++)34 {35 MyYData[j + k] = Convert.ToInt32(MyYData[j + k] - 50 + (Rand_Num.NextDouble() * 100));36 MyYData[100000 + j + k] = Convert.ToInt32(MyYData[j + k] - 50 + (Rand_Num.NextDouble() * 100));37 MyYData[j + k] += (float)Math.Sin(0.00033F * j) * 300.0F;38 }39}40// Perform the transfer of data //41Pesgo1.PeData.X.FastCopyFrom(MyXData, 200000);42Pesgo1.PeData.Y.FastCopyFrom(MyYData, 200000);43 44Pesgo1.PeGrid.MultiAxesSubsets[0] = 1; // 1 subset on first axis45Pesgo1.PeGrid.MultiAxesSubsets[1] = 1; // 1 subset on second axis46 47// Set Various Other Properties //48Pesgo1.PeColor.BitmapGradientMode = true;49Pesgo1.PeColor.QuickStyle = QuickStyle.LightLine;50 51Pesgo1.PeColor.SubsetColors[0] = Color.FromArgb(255, 30, 170, 170);52Pesgo1.PeColor.SubsetColors[0] = Color.FromArgb(255, 170, 170, 30);53Pesgo1.PePlot.Method = SGraphPlottingMethod.Line;54Pesgo1.PeLegend.SubsetLineTypes[0] = LineType.MediumSolid;55Pesgo1.PeString.TextShadows = TextShadows.NoShadows;56Pesgo1.PeLegend.Style = LegendStyle.OneLineInsideAxis;57 58Pesgo1.PeGrid.WorkingAxis = 0;59Pesgo1.PeString.YAxisLabel = "";60Pesgo1.PeGrid.WorkingAxis = 1;61Pesgo1.PeString.YAxisLabel = "";62Pesgo1.PeGrid.WorkingAxis = 0;63 64Pesgo1.PePlot.ZoomWindow.Show = true;65 66// Generally call ReinitializeResetImage at end **'67Pesgo1.PeFunction.ReinitializeResetImage();68Pesgo1.Invalidate();69// Optionally call Pesgo1.Refresh() if you are not seeing changes immediatelyTip: Uses property syntax like
Pego1.PeData.Y[s, p]Click underlined properties to view documentation