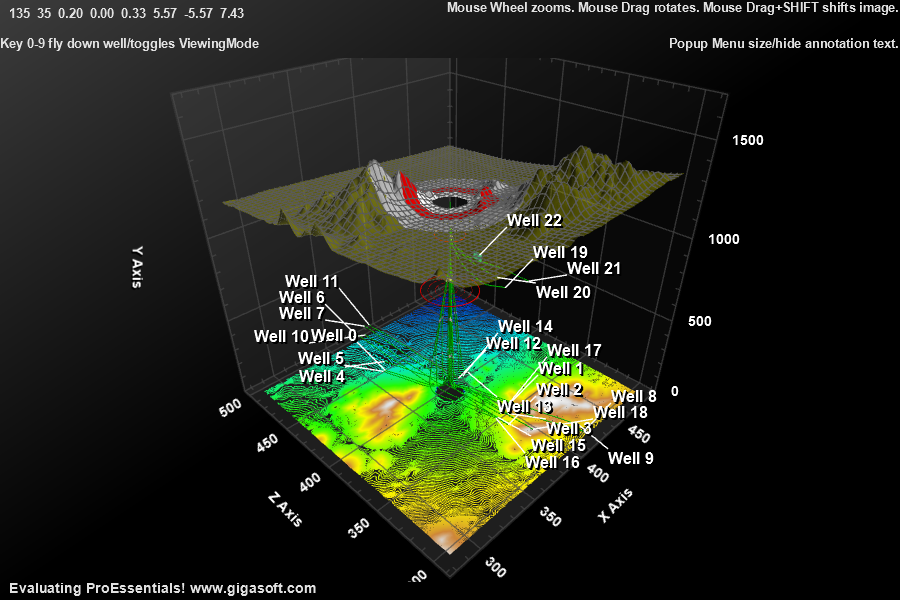
Example 403: 3D Surface with custom polygon colors
Pe3do3D Scientific Objectadvanced
Custom polygon colors
Form6.cs
1//! Left click and drag to rotate. Also Hold shift to translate. //2//! Mouse Wheel zooms in/out.3//! Middle Button hold down while drag rotates light. //4//! Right click to show popup menu. //5 6// This example builds upon the basic Create3DSimpleWireframe '400' example chart //7Create3DSimpleWireFrame(Pe3do1);8 9Pe3do1.PePlot.Option.DxZoomMax = 5F; // v10 New properties to control max and min mousewheel zoom10Pe3do1.PePlot.Option.DxZoomMin = -4F;11 12Pe3do1.PePlot.Option.DxViewportPanFactor = 2.0F; // v10 New properties to control shift/drag and mousewheel sensitivity13Pe3do1.PeUserInterface.Scrollbar.MouseWheelZoomFactor = 3.75F;14 15// Determine data range, as data is random16Pe3do1.PeFunction.Reinitialize();17float centerx = (float)(Pe3do1.PeGrid.Configure.ManualMaxX + Pe3do1.PeGrid.Configure.ManualMinX) / 2.0F;18float centerz = (float)(Pe3do1.PeGrid.Configure.ManualMaxZ + Pe3do1.PeGrid.Configure.ManualMinZ) / 2.0F;19float starty = Pe3do1.PeData.Y[99, 99]; // store the random y location for center of chart20 21// Set PlottingMethod //22Pe3do1.PePlot.Method = ThreeDGraphPlottingMethod.Two; // surface with shading23Pe3do1.PePlot.Option.ShowWireFrame = true;24 25// Initialize all Polygon Colors //26int s, p;27for (s = 0; s <= 199; s++)28{29 for (p = 0; p <= 199; p++)30 {31 Pe3do1.PePlot.PointColors[s, p] = Color.FromArgb(102, 178, 178, 0);32 }33}34 35// Make a simple target graphic by36// drawing larger and larger circle regions37int nx, ny;38Color c = Color.FromArgb(0, 0, 0, 0);39for (s = 1; s <= 10; s++)40{41 for (p = 0; p <= 359; p++)42 {43 nx = (int)(100 + Math.Cos((double)p) * s); ny = (int)(100 + Math.Sin((double)p) * s);44 Pe3do1.PePlot.PointColors[nx, ny] = c;45 46 // Make a null data area47 Pe3do1.PeData.Y[nx, ny] = 80.0F;48 }49}50c = Color.FromArgb(255, 198, 198, 198);51for (s = 11; s <= 20; s++)52{53 for (p = 0; p <= 359; p++)54 {55 nx = (int)(100 + Math.Cos((double)p) * s); ny = (int)(100 + Math.Sin((double)p) * s);56 Pe3do1.PePlot.PointColors[nx, ny] = c;57 }58}59c = Color.FromArgb(255, 178, 0, 0);60for (s = 21; s <= 30; s++)61{62 for (p = 0; p <= 359; p++)63 {64 nx = (int)(100 + Math.Cos((double)p) * s); ny = (int)(100 + Math.Sin((double)p) * s);65 Pe3do1.PePlot.PointColors[nx, ny] = c;66 }67}68c = Color.FromArgb(255, 148, 148, 148);69for (s = 31; s <= 50; s++)70{71 for (p = 0; p <= 359; p++)72 {73 nx = (int)(100 + Math.Cos((double)p) * s); ny = (int)(100 + Math.Sin((double)p) * s);74 Pe3do1.PePlot.PointColors[nx, ny] = c;75 }76}77 78// v9 features79Pe3do1.PeColor.ContourColorBlends = 40; // this must be set before COLORSET, COLORSET ALWAYS LAST80Pe3do1.PeColor.ContourColorSet = ContourColorSet.BlueCyanGreenYellowBrownWhite;81Pe3do1.PePlot.Option.ShowContour = ShowContour.BottomLines;82Pe3do1.PeLegend.ContourLegendPrecision = ContourLegendPrecision.TwoDecimals;83 84Pe3do1.PeUserInterface.Scrollbar.ViewingHeight = 35;85Pe3do1.PePlot.DegreeOfRotation = 135;86 87Pe3do1.PeUserInterface.Scrollbar.ScrollSmoothness = 3;88Pe3do1.PeUserInterface.Scrollbar.MouseWheelZoomSmoothness = 3;89Pe3do1.PeUserInterface.Scrollbar.PinchZoomSmoothness = 2;90 91Pe3do1.PeData.SurfaceNullDataGaps = true;92Pe3do1.PeUserInterface.HotSpot.Data = true;93 94Pe3do1.PeData.NullDataValue = 80;95//Pe3do1.PeColor.DxTransparencyMode = TransparencyMode.OIT;96 97Pe3do1.PeGrid.Configure.ManualScaleControlY = ManualScaleControl.MinMax;98Pe3do1.PeGrid.Configure.ManualMinY = 0;99Pe3do1.PeGrid.Configure.ManualMaxY = 1700;100 101Pe3do1.PePlot.Allow.WireFrame = false;102Pe3do1.PePlot.Allow.SurfaceContour = true;103Pe3do1.PeUserInterface.Dialog.Style = false;104Pe3do1.PeLegend.Show = true;105Pe3do1.PeUserInterface.Menu.LegendLocation = MenuControl.Show;106Pe3do1.PeColor.BarBorderColor = Color.FromArgb(250, 90, 90, 90);107 108// v9 features109Pe3do1.PeUserInterface.Cursor.PromptTracking = true;110Pe3do1.PeUserInterface.Cursor.PromptStyle = CursorPromptStyle.YValue;111Pe3do1.PeData.Precision = DataPrecision.TwoDecimals;112Pe3do1.PeUserInterface.Cursor.HighlightColor = Color.FromArgb(255, 255, 0, 0);113 114Pe3do1.PeUserInterface.Menu.DataShadow = MenuControl.Show;115 116// Add Well data as line/tube graph annotations117Pe3do1.PePlot.Option.DxFitControlShape = false;118Pe3do1.PePlot.Option.DxZoom = .2F;119 120int nWellCount = 0;121int aCnt = 0;122bool bFindFirst = true;123 124string[] fileArray = { "", "" };125try126{127 fileArray = File.ReadAllLines("DirData1.txt");128}129catch130{131 System.Windows.Forms.MessageBox.Show("Demo File Not Found?", "Error", System.Windows.Forms.MessageBoxButtons.OK);132}133 134for (int i = 0; i < fileArray.Length; i++)135{136 if (i >= 0)137 {138 String line = fileArray[i];139 if (line.Length < 3) { continue; }140 var columns = line.Split('\t');141 String valueY = columns[0];142 String valueZ = columns[1];143 String valueX = columns[2];144 145 if (valueY == "Y") // first line well data146 {147 bFindFirst = true;148 // Second well, add a text label to last point of previous well as Pointer annotation type //149 if (nWellCount > 0)150 {154 Pe3do1.PeAnnotation.Graph.Text[aCnt] = "|lWell " + (nWellCount - 1).ToString();155 Pe3do1.PeAnnotation.Graph.Type[aCnt] = (int)Gigasoft.ProEssentials.Enums.GraphAnnotationType.Pointer;156 Pe3do1.PeAnnotation.Graph.Color[aCnt] = Color.FromArgb(255, 255, 255, 255);157 MainWindow.m_nAnnotationStartIndices[nWellCount] = aCnt;158 aCnt++;159 }160 nWellCount++;161 continue;162 }163 164 float fY = float.Parse(valueY, CultureInfo.InvariantCulture.NumberFormat);165 float fZ = float.Parse(valueZ, CultureInfo.InvariantCulture.NumberFormat);166 float fX = float.Parse(valueX, CultureInfo.InvariantCulture.NumberFormat);167 168 Pe3do1.PeAnnotation.Graph.X[aCnt] = (-fX / 100) + centerx;169 Pe3do1.PeAnnotation.Graph.Z[aCnt] = (-fZ / 100) + centerz;170 Pe3do1.PeAnnotation.Graph.Y[aCnt] = starty - (fY / 9);171 Pe3do1.PeAnnotation.Graph.Text[aCnt] = "";172 Pe3do1.PeAnnotation.Graph.Color[aCnt] = Color.FromArgb(255, 0, 255, 0);173 175 Pe3do1.PeAnnotation.Graph.Color[aCnt] = Color.FromArgb(255, 255, 255, 255);177 Pe3do1.PeAnnotation.Graph.Color[aCnt] = Color.FromArgb(255, 255, 255, 255);179 Pe3do1.PeAnnotation.Graph.Color[aCnt] = Color.FromArgb(255, 255, 255, 255);181 Pe3do1.PeAnnotation.Graph.Color[aCnt] = Color.FromArgb(255, 255, 255, 255);183 Pe3do1.PeAnnotation.Graph.Color[aCnt] = Color.FromArgb(255, 255, 255, 255);184 185 if (bFindFirst)186 {187 Pe3do1.PeAnnotation.Graph.Type[aCnt] = (int)Gigasoft.ProEssentials.Enums.GraphAnnotationType.MediumSolidLine;188 bFindFirst = false;189 }190 else191 Pe3do1.PeAnnotation.Graph.Type[aCnt] = (int)Gigasoft.ProEssentials.Enums.GraphAnnotationType.LineContinue;192 aCnt++;193 }194}195// Example of drawing a polygon,196// or we could use the Rect annotation type as we are simply drawing a square //200Pe3do1.PeAnnotation.Graph.Text[aCnt] = "";201Pe3do1.PeAnnotation.Graph.Type[aCnt] = (int)Gigasoft.ProEssentials.Enums.GraphAnnotationType.StartPoly;202aCnt++;203 207Pe3do1.PeAnnotation.Graph.Text[aCnt] = "";208Pe3do1.PeAnnotation.Graph.Type[aCnt] = (int)Gigasoft.ProEssentials.Enums.GraphAnnotationType.AddPolyPoint;209aCnt++;210 214Pe3do1.PeAnnotation.Graph.Text[aCnt] = "";215Pe3do1.PeAnnotation.Graph.Type[aCnt] = (int)Gigasoft.ProEssentials.Enums.GraphAnnotationType.AddPolyPoint;216aCnt++;217 221Pe3do1.PeAnnotation.Graph.Text[aCnt] = "";222Pe3do1.PeAnnotation.Graph.Type[aCnt] = (int)Gigasoft.ProEssentials.Enums.GraphAnnotationType.EndPolygon;223Pe3do1.PeAnnotation.Graph.Color[aCnt] = Color.FromArgb(255, 0, 255, 255);224aCnt++;225 226// Example of drawing Ellipses227Pe3do1.PeAnnotation.Graph.X[aCnt] = 0;228Pe3do1.PeAnnotation.Graph.Y[aCnt] = 1;229Pe3do1.PeAnnotation.Graph.Z[aCnt] = 0;230Pe3do1.PeAnnotation.Graph.Text[aCnt] = "";231Pe3do1.PeAnnotation.Graph.Type[aCnt] = (int)Gigasoft.ProEssentials.Enums.GraphAnnotationType.AxisDirection;232aCnt++;233 234Pe3do1.PeAnnotation.Graph.X[aCnt] = 10;235Pe3do1.PeAnnotation.Graph.Y[aCnt] = 10;236Pe3do1.PeAnnotation.Graph.Z[aCnt] = 1;237Pe3do1.PeAnnotation.Graph.Text[aCnt] = "";238Pe3do1.PeAnnotation.Graph.Type[aCnt] = (int)Gigasoft.ProEssentials.Enums.GraphAnnotationType.MajorMinorRadii;239aCnt++;240 241Pe3do1.PeAnnotation.Graph.X[aCnt] = centerx;242Pe3do1.PeAnnotation.Graph.Z[aCnt] = centerz;243Pe3do1.PeAnnotation.Graph.Y[aCnt] = starty - 175;244Pe3do1.PeAnnotation.Graph.Text[aCnt] = "";245Pe3do1.PeAnnotation.Graph.Type[aCnt] = (int)Gigasoft.ProEssentials.Enums.GraphAnnotationType.EllipseMedium;246Pe3do1.PeAnnotation.Graph.Color[aCnt] = Color.FromArgb(255, 255, 0, 0);247aCnt++;248 249Pe3do1.PeAnnotation.Graph.X[aCnt] = 20;250Pe3do1.PeAnnotation.Graph.Y[aCnt] = 20;251Pe3do1.PeAnnotation.Graph.Z[aCnt] = 1;252Pe3do1.PeAnnotation.Graph.Text[aCnt] = "";253Pe3do1.PeAnnotation.Graph.Type[aCnt] = (int)Gigasoft.ProEssentials.Enums.GraphAnnotationType.MajorMinorRadii;254aCnt++;255 256Pe3do1.PeAnnotation.Graph.X[aCnt] = centerx;257Pe3do1.PeAnnotation.Graph.Z[aCnt] = centerz;258Pe3do1.PeAnnotation.Graph.Y[aCnt] = starty - 500;259Pe3do1.PeAnnotation.Graph.Text[aCnt] = "";260Pe3do1.PeAnnotation.Graph.Type[aCnt] = (int)Gigasoft.ProEssentials.Enums.GraphAnnotationType.EllipseMedium;261Pe3do1.PeAnnotation.Graph.Color[aCnt] = Color.FromArgb(255, 255, 0, 0);262aCnt++;263 264Pe3do1.PeAnnotation.Graph.X[aCnt] = 15;265Pe3do1.PeAnnotation.Graph.Y[aCnt] = 15;266Pe3do1.PeAnnotation.Graph.Z[aCnt] = 1;267Pe3do1.PeAnnotation.Graph.Text[aCnt] = "";268Pe3do1.PeAnnotation.Graph.Type[aCnt] = (int)Gigasoft.ProEssentials.Enums.GraphAnnotationType.MajorMinorRadii;269aCnt++;270 271Pe3do1.PeAnnotation.Graph.X[aCnt] = centerx;272Pe3do1.PeAnnotation.Graph.Z[aCnt] = centerz;273Pe3do1.PeAnnotation.Graph.Y[aCnt] = starty - 500;274Pe3do1.PeAnnotation.Graph.Text[aCnt] = "";275Pe3do1.PeAnnotation.Graph.Type[aCnt] = (int)Gigasoft.ProEssentials.Enums.GraphAnnotationType.EllipseThin;276Pe3do1.PeAnnotation.Graph.Color[aCnt] = Color.FromArgb(255, 255, 0, 0);277aCnt++;278 279Pe3do1.PeAnnotation.Graph.X[aCnt] = 10;280Pe3do1.PeAnnotation.Graph.Y[aCnt] = 10;281Pe3do1.PeAnnotation.Graph.Z[aCnt] = 1;282Pe3do1.PeAnnotation.Graph.Text[aCnt] = "";283Pe3do1.PeAnnotation.Graph.Type[aCnt] = (int)Gigasoft.ProEssentials.Enums.GraphAnnotationType.MajorMinorRadii;284aCnt++;285 286Pe3do1.PeAnnotation.Graph.X[aCnt] = centerx;287Pe3do1.PeAnnotation.Graph.Z[aCnt] = centerz;288Pe3do1.PeAnnotation.Graph.Y[aCnt] = starty - 500;289Pe3do1.PeAnnotation.Graph.Text[aCnt] = "";290Pe3do1.PeAnnotation.Graph.Type[aCnt] = (int)Gigasoft.ProEssentials.Enums.GraphAnnotationType.EllipseThin;291Pe3do1.PeAnnotation.Graph.Color[aCnt] = Color.FromArgb(255, 255, 0, 0);292aCnt++;293 294Pe3do1.PeAnnotation.Graph.X[aCnt] = 5;295Pe3do1.PeAnnotation.Graph.Y[aCnt] = 5;296Pe3do1.PeAnnotation.Graph.Z[aCnt] = 1;297Pe3do1.PeAnnotation.Graph.Text[aCnt] = "";298Pe3do1.PeAnnotation.Graph.Type[aCnt] = (int)Gigasoft.ProEssentials.Enums.GraphAnnotationType.MajorMinorRadii;299aCnt++;300 301Pe3do1.PeAnnotation.Graph.X[aCnt] = centerx;302Pe3do1.PeAnnotation.Graph.Z[aCnt] = centerz;303Pe3do1.PeAnnotation.Graph.Y[aCnt] = starty - 500;304Pe3do1.PeAnnotation.Graph.Text[aCnt] = "";305Pe3do1.PeAnnotation.Graph.Type[aCnt] = (int)Gigasoft.ProEssentials.Enums.GraphAnnotationType.EllipseThin;306Pe3do1.PeAnnotation.Graph.Color[aCnt] = Color.FromArgb(255, 255, 0, 0);307aCnt++;308 309// if one wants to control tube min thickness and range of thicknesses310Pe3do1.PePlot.Option.TubeThicknessMin = .5f;311Pe3do1.PePlot.Option.TubeThicknessInc = 1.0f;312Pe3do1.PePlot.LinesOrTubes = LinesOrTubes.AllTubes;313 314// Other graph annotation settings //315Pe3do1.PeAnnotation.InFront = false;316Pe3do1.PeAnnotation.Show = true;317Pe3do1.PeAnnotation.Graph.Show = true;318Pe3do1.PeAnnotation.Graph.LeftJustificationOutside = true;319Pe3do1.PeAnnotation.Graph.SymbolObstacles = true;320Pe3do1.PeFont.GraphAnnotationTextSize = 110;321Pe3do1.PeUserInterface.HotSpot.GraphAnnotation = true;322 323Pe3do1.PeUserInterface.Menu.AnnotationControl = true;324Pe3do1.PeUserInterface.Menu.ShowAnnotationText = MenuControl.Show;325Pe3do1.PeUserInterface.Menu.AnnotationTextFixedSize = MenuControl.Show;326Pe3do1.PeUserInterface.Menu.Rotation = MenuControl.Hide; // only double click327 328Pe3do1.PeUserInterface.Menu.CustomMenuText[0] = "Zoom Rotate on Center ";329Pe3do1.PeUserInterface.Menu.CustomMenuState[0, 0] = CustomMenuState.Checked;330Pe3do1.PeUserInterface.Menu.CustomMenuLocation[0] = CustomMenuLocation.AboveSeparator;331 332// Set a default ViewingAt location.333float x, y, z;334x = (float)Pe3do1.PeAnnotation.Graph.X[0];335y = (float)Pe3do1.PeAnnotation.Graph.Y[0];336z = (float)Pe3do1.PeAnnotation.Graph.Z[0];337Pe3do1.PeFunction.SetViewingAt(x, y, z);338 339Pe3do1.PeUserInterface.HotSpot.DxScatterOctTreeSize = 20000; // optimizes speed hit testing so rotation is smoother340 341// Enable CursorPromptTracking HighlighColor, etc only applicable to Direct3D RenderEngine342Pe3do1.PeUserInterface.Cursor.PromptTracking = true;343Pe3do1.PeUserInterface.Cursor.PromptStyle = CursorPromptStyle.YValue; // only y and xyz are options.344Pe3do1.PeUserInterface.Cursor.TrackingCustomDataText = true;345Pe3do1.PeUserInterface.Cursor.PromptLocation = CursorPromptLocation.ToolTip;346Pe3do1.PeUserInterface.Cursor.TrackingCustomOtherText = true;347 348Pe3do1.PeUserInterface.Cursor.TrackingTooltipBkColor = Color.FromArgb(0, 80, 80, 80);349Pe3do1.PeUserInterface.Cursor.TrackingTooltipTextColor = Color.FromArgb(0, 245, 245, 245);350Pe3do1.PeUserInterface.Cursor.TrackingTooltipMaxWidth = 200;351 352Pe3do1.PeString.MultiSubTitles[1] = "Key 0-9 fly down well/toggles ViewingMode| |Popup Menu size/hide annotation text.";353 354 355Pe3do1.PeFunction.Force3dxNewColors = true;356Pe3do1.PeFunction.Force3dxVerticeRebuild = true;357Pe3do1.PeFunction.Force3dxAnnotVerticeRebuild = true;358 359Pe3do1.PeFunction.ReinitializeResetImage();360Pe3do1.Invalidate();361Pe3do1.Refresh();362 363/*364/////////////////////////////365// MouseMove event handler //366/////////////////////////////367private void Pe3do1_MouseMove(object sender, MouseEventArgs e)368{369 Gigasoft.ProEssentials.Structs.HotSpotData ds = Pe3do1.PeFunction.GetHotSpot();370 371 // get ydata value at hot spot //372 if (ds.Type == HotSpotType.DataPoint)373 {374 this.Text = "DataPoint value " + Pe3do1.PeData.Y[ds.Data1, ds.Data2].ToString() + " s=" + ds.Data1.ToString() + " p=" + ds.Data2.ToString();375 // or to get the interpolated value under the mouse for surface376 //this.Text = "DataPoint value " + Pe3do1.PeUserInterface.Cursor.CursorValueY.ToString() + " s=" + ds.Data1.ToString() + " p=" + ds.Data2.ToString();377 }378 else if (ds.Type == HotSpotType.Annotation && Pe3do1.PeAnnotation.Show )379 {380 this.Text = "Well values X= " + Pe3do1.PeAnnotation.Graph.X[ds.Data1].ToString() + " Z=" + Pe3do1.PeAnnotation.Graph.Z[ds.Data1].ToString() + " Y=" + Pe3do1.PeAnnotation.Graph.Y[ds.Data1].ToString();381 }382}383 384private void Pe3do1_PeCustomTrackingDataText(object sender, Gigasoft.ProEssentials.EventArg.CustomTrackingDataTextEventArgs e)385{386 Gigasoft.ProEssentials.Structs.HotSpotData ds = Pe3do1.PeFunction.GetHotSpot();387 388 // get ydata value at hot spot //389 if (ds.Type == HotSpotType.DataPoint)390 {391 e.TrackingText = String.Format("Surface data\nY={0:0.000}\nSubset:{1}, Point:{2} ",Pe3do1.PeData.Y[ds.Data1, ds.Data2], ds.Data1, ds.Data2);392 // or to get the interpolated value under the mouse for surface393 //this.Text = "DataPoint value " + Pe3do1.PeUserInterface.Cursor.CursorValueY.ToString() + " s=" + ds.Data1.ToString() + " p=" + ds.Data2.ToString();394 }395}396 397*/Tip: Uses property syntax like
Pego1.PeData.Y[s, p]Click underlined properties to view documentation