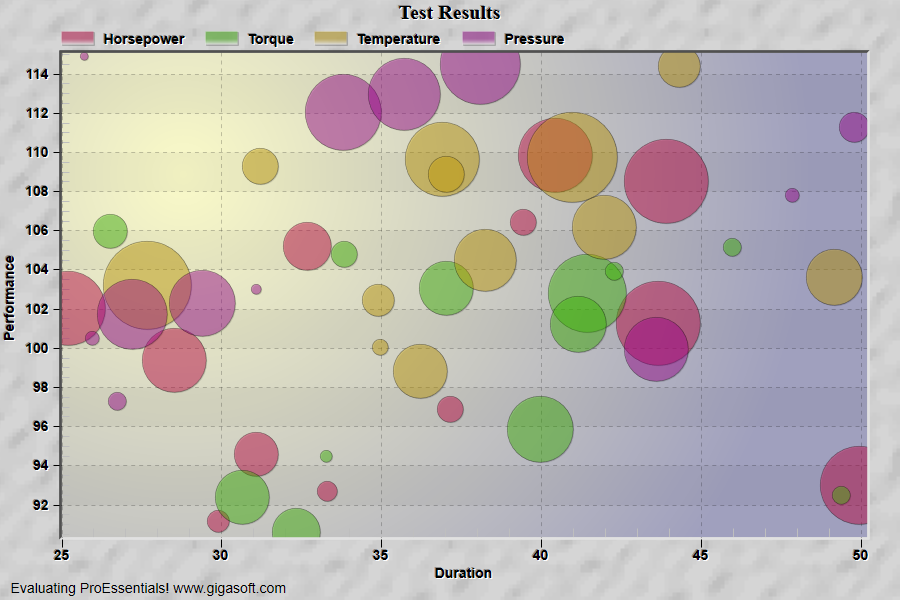
Example 126: Scientific Graph showing Bubble chart
PesgoScientific Graph Objectbeginner
Bubble chart
Form3.cs
1// This example builds upon the basic CreateSimpleSGraph '100' example chart //2CreateSimpleSGraph(Pesgo1);3 4// Change the data to that of a scatter plot //5Pesgo1.PeData.Subsets = 4;6Pesgo1.PeData.Points = 12;7 8int s, p;9for (s = 0; s <= 3; s++)10{11 for (p = 0; p <= 11; p++)12 {13 Pesgo1.PeData.X[s, p] = (float)(25 + Rand_Num.NextDouble() * (25));14 Pesgo1.PeData.Y[s, p] = (float)(90 + Rand_Num.NextDouble() * (25));15 16 // Bubble Charts Use ZData also //17 Pesgo1.PeData.Z[s, p] = (float)(10 + Rand_Num.NextDouble() * (25));18 }19}20 21// Set the PlottingMethod to bubble //22Pesgo1.PePlot.Method = SGraphPlottingMethod.Bubble;23 24// Enable data hot spots //25Pesgo1.PeUserInterface.HotSpot.Data = true;26 27// Make Data hots spot locations larger //28Pesgo1.PeUserInterface.HotSpot.Size = HotSpotSize.Large;29 30// Set Various Other Properties ///31Pesgo1.PeColor.BitmapGradientMode = true;32Pesgo1.PeColor.QuickStyle = QuickStyle.LightInset;33 34// subset colors with alpha //35Pesgo1.PeColor.SubsetColors[0] = MainWindow.aDemoColors[0];36Pesgo1.PeColor.SubsetColors[1] = MainWindow.aDemoColors[1];37Pesgo1.PeColor.SubsetColors[2] = MainWindow.aDemoColors[2];38Pesgo1.PeColor.SubsetColors[3] = MainWindow.aDemoColors[3];39 40// Disable some types of plotting methods //41Pesgo1.PePlot.Allow.Bubble = true;42Pesgo1.PePlot.Allow.Spline = false;43Pesgo1.PePlot.Allow.PointsPlusSpline = false;44Pesgo1.PePlot.Allow.BestFitLine = false;45Pesgo1.PePlot.Allow.BestFitCurve = false;46Pesgo1.PePlot.Allow.Area = false;47Pesgo1.PePlot.Allow.SplineArea = false;48 49// Generally call ReinitializeResetImage at end **'50Pesgo1.PeFunction.ReinitializeResetImage();51Pesgo1.Invalidate();52// Optionally call Pesgo1.Refresh() if you are not seeing changes immediatelyTip: Uses property syntax like
Pego1.PeData.Y[s, p]Click underlined properties to view documentation