English
中文 - Chinese
한국어 - Korean
日本語 - Japanese
Deutsche - German
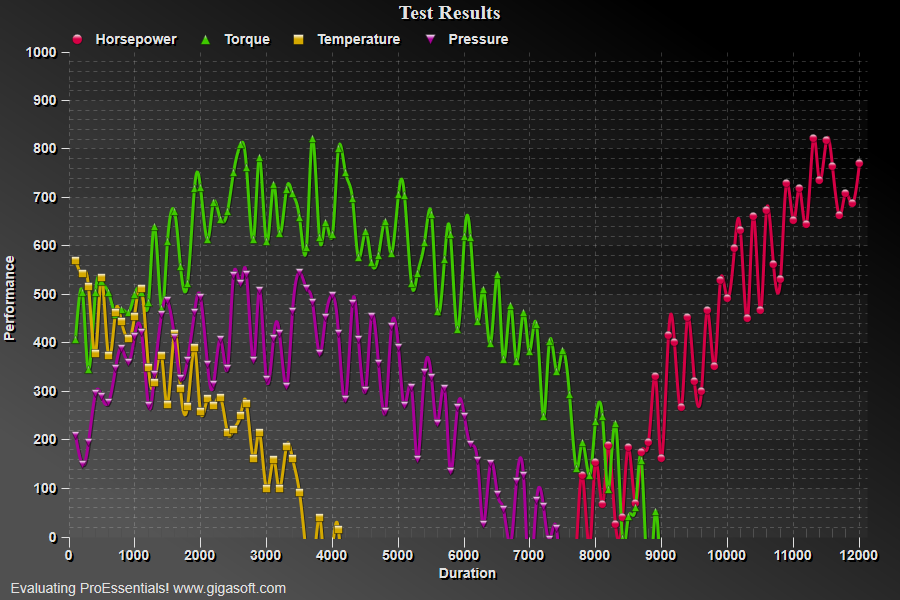
Manual min and max y
1//! Very simple example showing how to control min and max of an axis. //2 3// This example builds upon the basic CreateSimpleSGraph '100' example chart //4CreateSimpleSGraph(Pesgo1);5 6// Manually Control Y Axis//7Pesgo1.PeGrid.Configure.ManualScaleControlY = ManualScaleControl.MinMax;8Pesgo1.PeGrid.Configure.ManualMinY = 0;9Pesgo1.PeGrid.Configure.ManualMaxY = 1000;10 11// Set Various Other Properties //12Pesgo1.PeColor.BitmapGradientMode = true;13Pesgo1.PeColor.QuickStyle = QuickStyle.DarkNoBorder;14Pesgo1.PeGrid.LineControl = GridLineControl.Both;15Pesgo1.PeGrid.Option.YAxisLongTicks = true;16 17// Generally call ReinitializeResetImage at end **'18Pesgo1.PeFunction.ReinitializeResetImage();19Pesgo1.Invalidate();20// Optionally call Pego1.Refresh() if you are not seeing changes immediately
Pego1.PeData.Y[s, p]