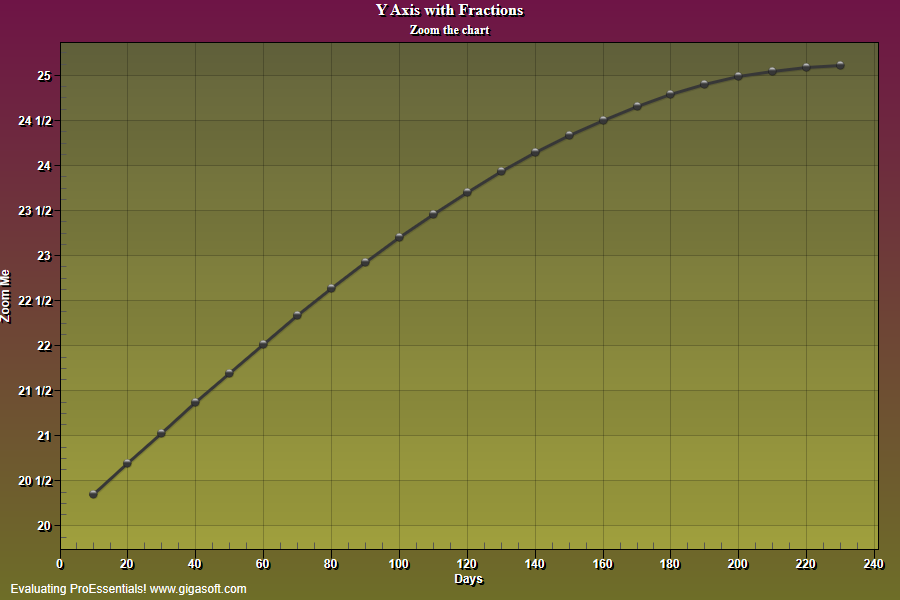
Example 111: Scientific Graph showing financial scaling
PesgoScientific Graph Objectintermediate
Financial scaling
Form3.cs
1// Set Financial Scaling //2Pesgo1.PeGrid.Option.SpecialScalingY = SpecialScaling.Financial;3 4// Enable Zooming, Zoom graph to see how y axis changes. //5Pesgo1.PeUserInterface.Allow.Zooming = AllowZooming.HorzAndVert;6Pesgo1.PeUserInterface.Scrollbar.MouseDraggingX = true;7Pesgo1.PeUserInterface.Scrollbar.MouseDraggingY = true;8 9Pesgo1.PeData.Subsets = 1;10Pesgo1.PeData.Points = 24;11 12// Pass Data //13int p;14for (p = 0; p <= 23; p++)15{16 Pesgo1.PeData.X[0, p] = p * 10;17 Pesgo1.PeData.Y[0, p] = (float)(20.0 + (0 + (Math.Sin(p * 0.074) * 4.0) + (p / 20.0)));18}19 20// Set some colors and etc //21Pesgo1.PeColor.BitmapGradientMode = true;22Pesgo1.PeColor.QuickStyle = QuickStyle.MediumLine;23Pesgo1.PeColor.SubsetColors[0] = Color.FromArgb(255, 55, 55, 55);24Pesgo1.PeLegend.SubsetLineTypes[0] = LineType.MediumSolid;25Pesgo1.PeConfigure.PrepareImages = true;26Pesgo1.PeConfigure.CacheBmp = true;27 28Pesgo1.PePlot.MarkDataPoints = false;29Pesgo1.PeString.MainTitle = "Y Axis with Fractions";30Pesgo1.PeString.SubTitle = "Zoom the chart";31Pesgo1.PeString.YAxisLabel = "Zoom Me";32Pesgo1.PeString.XAxisLabel = "Days";33 34Pesgo1.PeUserInterface.Allow.ZoomStyle = ZoomStyle.Ro2Not;35 36Pesgo1.PePlot.Option.GradientBars = 8;37Pesgo1.PeConfigure.TextShadows = TextShadows.BoldText;40Pesgo1.PeFont.Label.Bold = true;41Pesgo1.PePlot.Option.LineShadows = true;43Pesgo1.PeUserInterface.Scrollbar.ScrollingHorzZoom = true;44Pesgo1.PePlot.Method = SGraphPlottingMethod.PointsPlusLine;45 46Pesgo1.PePlot.Option.PointGradientStyle = PlotGradientStyle.VerticalAscentInverse;47Pesgo1.PeColor.PointBorderColor = Color.FromArgb(100, 0, 0, 0);48Pesgo1.PePlot.Option.LineSymbolThickness = 3;49Pesgo1.PePlot.Option.AreaBorder = 1;50 51// Set various export defaults //52Pesgo1.PeSpecial.DpiX = 600;53Pesgo1.PeSpecial.DpiY = 600;54 55// default export setting //56Pesgo1.PeUserInterface.Dialog.ExportSizeDef = ExportSizeDef.NoSizeOrPixel;57Pesgo1.PeUserInterface.Dialog.ExportTypeDef = ExportTypeDef.Png;58Pesgo1.PeUserInterface.Dialog.ExportDestDef = ExportDestDef.Clipboard;59Pesgo1.PeUserInterface.Dialog.ExportUnitXDef = "1280";60Pesgo1.PeUserInterface.Dialog.ExportUnitYDef = "768";61Pesgo1.PeUserInterface.Dialog.ExportImageDpi = 300;62 63// v9 features64Pesgo1.PeUserInterface.Cursor.PromptTracking = true;65Pesgo1.PeUserInterface.Cursor.PromptStyle = CursorPromptStyle.XYValues;66Pesgo1.PeUserInterface.Cursor.PromptLocation = CursorPromptLocation.ToolTip;67 68Pesgo1.PeConfigure.RenderEngine = RenderEngine.Direct2D;69Pesgo1.PeConfigure.AntiAliasGraphics = true;70Pesgo1.PeConfigure.AntiAliasText = true;71 72// Generally call ReinitializeResetImage at end **'73Pesgo1.PeFunction.ReinitializeResetImage();74Pesgo1.Invalidate();75// Optionally call Pego1.Refresh() if you are not seeing changes immediatelyTip: Uses property syntax like
Pego1.PeData.Y[s, p]Click underlined properties to view documentation