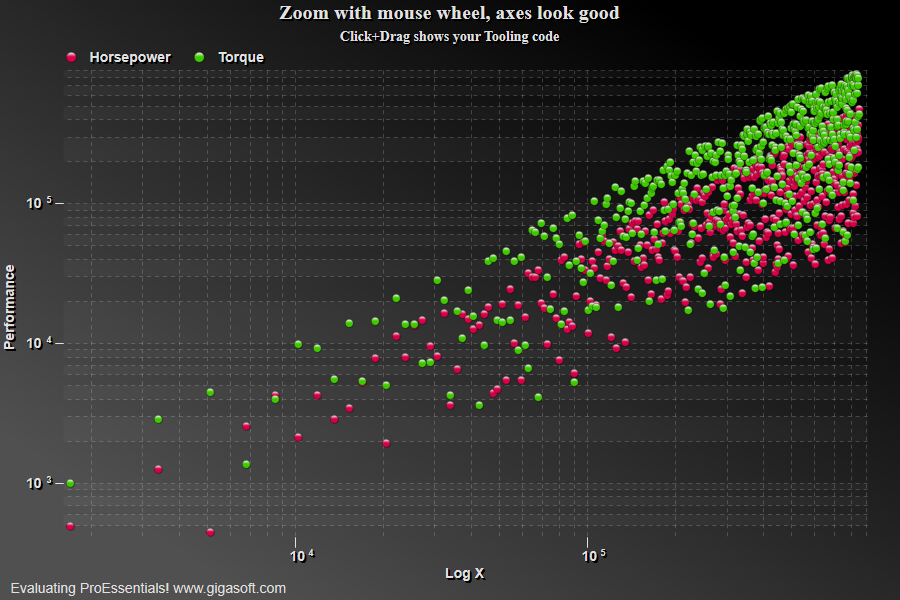
Example 110: Scientific Graph showing log-log axes
PesgoScientific Graph Objectadvanced
Log-log axes
Form3.cs
1//! Zoom this chart with mousewheel to see how ProEssentials handles log scales. //2//! Zoom by dragging mouse to demonstrate quick annotation tooling. //3 4// This example builds upon the basic CreateSimpleSGraph '100' example chart //5CreateSimpleSGraph(Pesgo1);6 7// Set Log scales //8Pesgo1.PeGrid.Configure.YAxisScaleControl = Gigasoft.ProEssentials.Enums.ScaleControl.Log;9Pesgo1.PeGrid.Configure.XAxisScaleControl = Gigasoft.ProEssentials.Enums.ScaleControl.Log;10 11// Set Various Other Properties //12Pesgo1.PeColor.BitmapGradientMode = true;13Pesgo1.PeColor.QuickStyle = QuickStyle.DarkNoBorder;14Pesgo1.PeGrid.LineControl = GridLineControl.Both;16 17// Change data so it varies over wider range //18int subset, pnt;19 20Pesgo1.PeData.Subsets = 2;21Pesgo1.PeData.Points = 500;22 23for (subset = 0; subset <= 1; subset++)24{25 for (pnt = 0; pnt <= 499; pnt++)26 {27 Pesgo1.PeData.X[subset, pnt] = (pnt + 1) * 1700;28 Pesgo1.PeData.Y[subset, pnt] = (float)(((pnt + 1) * 100) + ((Rand_Num.NextDouble() * 850) * (pnt + 1) * (subset + 1)));29 }30}31 32Pesgo1.PePlot.Method = SGraphPlottingMethod.Point;33Pesgo1.PePlot.MarkDataPoints = false;34Pesgo1.PeLegend.SubsetPointTypes[0] = PointType.DotSolid;35Pesgo1.PeLegend.SubsetPointTypes[1] = PointType.DotSolid;36 37Pesgo1.PeString.MainTitle = "Zoom with mouse wheel, axes look good";38Pesgo1.PeString.SubTitle = "Click+Drag shows your Tooling code";39Pesgo1.PeString.XAxisLabel = "Log X";40 41// v9 features42Pesgo1.PeUserInterface.Cursor.Mode = CursorMode.DataCross;43 44Pesgo1.PeUserInterface.Cursor.MouseCursorControl = true;45Pesgo1.PeUserInterface.HotSpot.Data = true;46Pesgo1.PeUserInterface.Cursor.MouseCursorControlClosestPoint = false;47Pesgo1.PeUserInterface.Scrollbar.MouseDraggingX = false;48Pesgo1.PeUserInterface.Scrollbar.MouseDraggingY = false;49 50Pesgo1.PeConfigure.CacheBmp2 = true;51Pesgo1.PeUserInterface.Cursor.ImprovedCursor = true;52Pesgo1.PeUserInterface.Cursor.DrawCursorToCache = true;53Pesgo1.PeUserInterface.Cursor.CursorColor = Color.Red;54Pesgo1.PeUserInterface.Cursor.VertLineType = LineAnnotationType.Dash;55Pesgo1.PeUserInterface.Cursor.HorzLineType = LineAnnotationType.Dash;56 57Pesgo1.PeUserInterface.Allow.Zooming = AllowZooming.None; // zoom by mouse wheel58Pesgo1.PeUserInterface.Scrollbar.MouseWheelFunction = MouseWheelFunction.HorizontalVerticalZoom;59Pesgo1.PeUserInterface.Scrollbar.MouseWheelZoomSmoothness = 8;60 61// Generally call ReinitializeResetImage at end **'62Pesgo1.PeFunction.ReinitializeResetImage();63Pesgo1.Invalidate();64// Optionally call Pego1.Refresh() if you are not seeing changes immediately65 66/*//////////////////////////////////////////////////67// MouseDown ///68////////////////69if (m_nChart == 110)70{71 bDragging = true;72 Point pt = Pesgo1.PeUserInterface.Cursor.LastMouseMove;73 74 int nA, nX, nY;75 double fX = 0, fY = 0;76 77 nA = 0; // Set if using OverlapMultiAxes, else this function returns axis if MultiAxesSubsets is used without OverlapMultiAxes78 nX = pt.X;79 nY = pt.Y;80 // This returns mouse coordinates in data units //81 Pesgo1.PeFunction.ConvPixelToGraph(ref nA, ref nX, ref nY, ref fX, ref fY, false, false, false);82 83 // Check move-to location and restrain to the chart's extents.84 // Note that you can only expect to read valid ManualMinX type85 // properties after an initial chart has been visible on screen86 if (fX <= Pesgo1.PeGrid.Configure.ManualMinX)87 fX = Pesgo1.PeGrid.Configure.ManualMinX;88 else if (fX >= Pesgo1.PeGrid.Configure.ManualMaxX)89 fX = Pesgo1.PeGrid.Configure.ManualMaxX;90 if (fY <= Pesgo1.PeGrid.Configure.ManualMinY)91 fY = Pesgo1.PeGrid.Configure.ManualMinY;92 else if (fY >= Pesgo1.PeGrid.Configure.ManualMaxY)93 fY = Pesgo1.PeGrid.Configure.ManualMaxY;94 95 Pesgo1.PeUserInterface.Cursor.PromptStyle = CursorPromptStyle.None;96 97 dDragStartX = fX;98 dDragStartY = fY;99}100 101 102/////////////////////////////////////////////103// MouseMove ///104////////////////105else if (m_nChart == 110 && bDragging == true)106{107 int nA, nX, nY;108 double fX = 0, fY = 0;109 Point pt = Pesgo1.PeUserInterface.Cursor.LastMouseMove;110 111 nA = 0; // Set if using OverlapMultiAxes, else this function returns axis if MultiAxesSubsets is used without OverlapMultiAxes112 nX = pt.X;113 nY = pt.Y;114 // This returns mouse coordinates in data units //115 Pesgo1.PeFunction.ConvPixelToGraph(ref nA, ref nX, ref nY, ref fX, ref fY, false, false, false);116 117 // Check move-to location and restrain to the chart's extents.118 // Note that you can only expect to read valid ManualMinX type119 // properties after an initial chart has been visible on screen120 if (fX <= Pesgo1.PeGrid.Configure.ManualMinX)121 fX = Pesgo1.PeGrid.Configure.ManualMinX;122 else if (fX >= Pesgo1.PeGrid.Configure.ManualMaxX)123 fX = Pesgo1.PeGrid.Configure.ManualMaxX;124 if (fY <= Pesgo1.PeGrid.Configure.ManualMinY)125 fY = Pesgo1.PeGrid.Configure.ManualMinY;126 else if (fY >= Pesgo1.PeGrid.Configure.ManualMaxY)127 fY = Pesgo1.PeGrid.Configure.ManualMaxY;128 129 double dLeft;130 double dTop;131 double dRight;132 double dBottom;133 134 if (dDragStartX < fX)135 {136 dLeft = dDragStartX;137 dRight = fX;138 }139 else140 {141 dLeft = fX;142 dRight = dDragStartX;143 }144 145 if (dDragStartY > fY)146 {147 dTop = dDragStartY;148 dBottom = fY;149 }150 else151 {152 dTop = fY;153 dBottom = dDragStartY;154 }155 156 Pesgo1.PeAnnotation.Graph.X[0] = dLeft;157 Pesgo1.PeAnnotation.Graph.Y[0] = dTop;158 Pesgo1.PeAnnotation.Graph.Type[0] = ((int)GraphAnnotationType.TopLeft + 1) * -1;159 160 Pesgo1.PeAnnotation.Graph.X[1] = dRight;161 Pesgo1.PeAnnotation.Graph.Y[1] = dBottom;162 Pesgo1.PeAnnotation.Graph.Type[1] = ((int)GraphAnnotationType.BottomRight + 1) * -1;163 164 Pesgo1.PeAnnotation.Graph.X[2] = dRight;165 Pesgo1.PeAnnotation.Graph.Y[2] = dBottom;166 Pesgo1.PeAnnotation.Graph.Type[2] = ((int)GraphAnnotationType.RoundRectFill + 1) * -1;167 Pesgo1.PeAnnotation.Graph.Color[2] = Color.FromArgb(70, 198, 198, 198);168 Pesgo1.PeAnnotation.Graph.Text[2] = "";169 Pesgo1.PeAnnotation.Graph.GradientStyle[2] = (int)Gigasoft.ProEssentials.Enums.PlotGradientStyle.RadialBottomRight;170 Pesgo1.PeAnnotation.Graph.GradientColor[2] = Color.FromArgb(170, 255, 255, 255);171 172 Pesgo1.PeAnnotation.Graph.X[3] = dRight;173 Pesgo1.PeAnnotation.Graph.Y[3] = dBottom;174 Pesgo1.PeAnnotation.Graph.Type[3] = ((int)GraphAnnotationType.RoundRectMedium + 1) * -1;175 Pesgo1.PeAnnotation.Graph.Color[3] = Color.FromArgb(255, 255, 255, 255);176 Pesgo1.PeAnnotation.Graph.Text[3] = "";177 178 double CenteredXInLog = (Math.Log10(fX) + Math.Log10(dDragStartX)) / 2.0F;179 double CenteredYInLog = (Math.Log10(fY) + Math.Log10(dDragStartY)) / 2.0F;180 double dX = (fX - dDragStartX);181 string sX = string.Format("{0:0.#}", dX);182 double dY = (fY - dDragStartY);183 string sY = string.Format("{0:0.#}", dY);184 185 Pesgo1.PeAnnotation.Graph.X[4] = Math.Pow(10.0F, CenteredXInLog);186 Pesgo1.PeAnnotation.Graph.Y[4] = dTop;187 Pesgo1.PeAnnotation.Graph.Color[4] = Color.FromArgb(255, 0, 255, 0);188 Pesgo1.PeAnnotation.Graph.Type[4] = ((int)GraphAnnotationType.NoSymbol + 1) * -1;189 Pesgo1.PeAnnotation.Graph.Text[4] = "|c<~ " + sX + " ~>";190 191 Pesgo1.PeAnnotation.Graph.X[5] = dRight;192 Pesgo1.PeAnnotation.Graph.Y[5] = Math.Pow(10.0F, CenteredYInLog);193 Pesgo1.PeAnnotation.Graph.Type[5] = ((int)GraphAnnotationType.NoSymbol + 1) * -1;194 Pesgo1.PeAnnotation.Graph.Color[5] = Color.FromArgb(255, 0, 255, 0);195 Pesgo1.PeAnnotation.Graph.Text[5] = "|D<~ " + sY + " ~>";196 197 Pesgo1.PeAnnotation.Graph.TextSize = 120;198 199 Pesgo1.PeAnnotation.Graph.Show = true;200 Pesgo1.PeAnnotation.Show = true;201 202 Pesgo1.PeAnnotation.ShowingQuickAnnotations = true;203 Pesgo1.Invalidate();204 Pesgo1.Refresh();205}206 207/////////////////////////////////////////////208// MouseUp ///209//////////////210if (m_nChart == 110 && bDragging == true)211{212 bDragging = false;213 Pesgo1.PeAnnotation.ShowingQuickAnnotations = false;214 Pesgo1.PeAnnotation.HidingQuickAnnotations = true;215 Pesgo1.PeUserInterface.Cursor.PromptStyle = CursorPromptStyle.XYValues;216 Pesgo1.Invalidate();217 Pesgo1.Refresh();218}219 220*/Tip: Uses property syntax like
Pego1.PeData.Y[s, p]Click underlined properties to view documentation