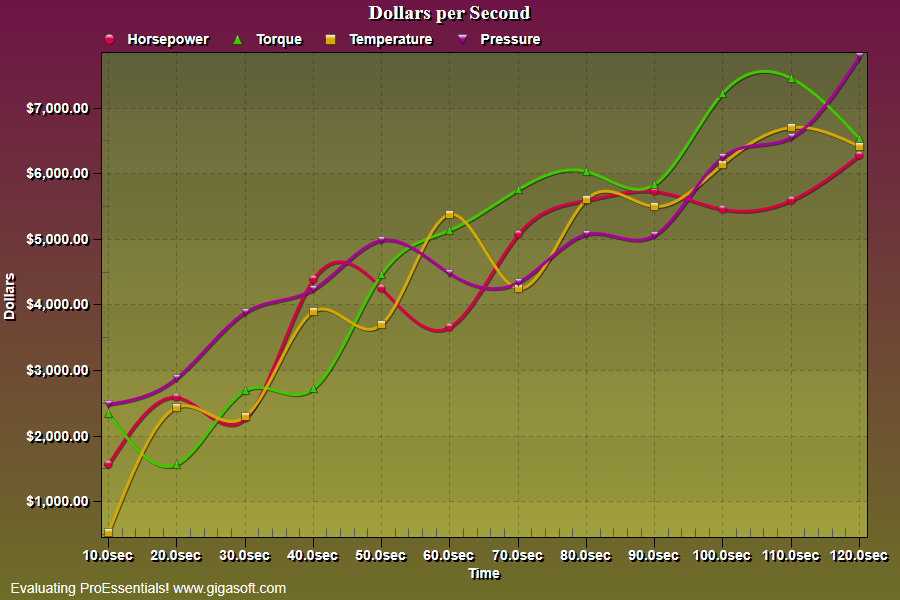
Example 109: Scientific Graph showing axis formatting
PesgoScientific Graph Objectbeginner
Axis formatting
Form3.cs
1//! Note YAxis and XAxis grid number formatting. //2 3// This example builds upon the basic CreateSimpleSGraph '100' example chart //4CreateSimpleSGraph(Pesgo1);5 6// Change data to make it larger //7Pesgo1.PeData.Subsets = 4;8Pesgo1.PeData.Points = 12;9 10int s, p;11for (s = 0; s <= 3; s++)12{13 for (p = 0; p <= 11; p++)14 {15 Pesgo1.PeData.X[s, p] = (p + 1) * 10;16 Pesgo1.PeData.Y[s, p] = (float)((p + 1) * 500 + (Rand_Num.NextDouble() * 2500));17 }18}19 20// Supply formatting string //21Pesgo1.PeGrid.Option.AxisFormatY = "$|,.00|";22Pesgo1.PeGrid.Option.AxisFormatX = "|.0|sec";23 24// Labels //25Pesgo1.PeString.MainTitle = "Dollars per Second";26Pesgo1.PeString.YAxisLabel = "Dollars";27Pesgo1.PeString.XAxisLabel = "Time";28 29// Set Various Other Properties ///30Pesgo1.PeColor.BitmapGradientMode = true;31Pesgo1.PeColor.QuickStyle = QuickStyle.MediumLine;32Pesgo1.PePlot.Method = SGraphPlottingMethod.PointsPlusSpline;33Pesgo1.PePlot.Option.BestFitDegree = BestFitDegree.Fourth;34 35Pesgo1.PePlot.Option.PointGradientStyle = PlotGradientStyle.VerticalAscentInverse;36Pesgo1.PeColor.PointBorderColor = Color.FromArgb(100, 0, 0, 0);37Pesgo1.PePlot.Option.LineSymbolThickness = 3;38Pesgo1.PePlot.Option.AreaBorder = 1;39 40// Generally call ReinitializeResetImage at end **'41Pesgo1.PeFunction.ReinitializeResetImage();42Pesgo1.Invalidate();43// Optionally call Pego1.Refresh() if you are not seeing changes immediatelyTip: Uses property syntax like
Pego1.PeData.Y[s, p]Click underlined properties to view documentation