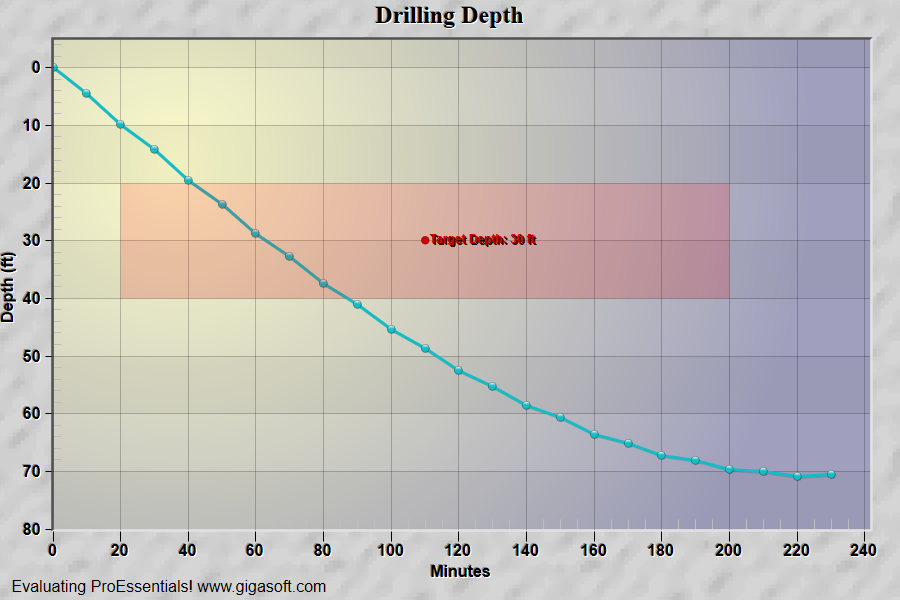
Example 108: Scientific Graph showing inverted y axis
PesgoScientific Graph Objectintermediate
Inverted y axis
Form3.cs
1Pesgo1.PeData.Subsets = 1;2Pesgo1.PeData.Points = 24;3 4// Make sure zeros are plotted //5Pesgo1.PeData.NullDataValueX = -999;6Pesgo1.PeData.NullDataValue = -999;7 8// Invert polarity of Y axis //9Pesgo1.PeGrid.Option.InvertedYAxis = true;10 11// Pass data and since InvertedYAxis = true then make sure YData is //12// multiplied by -1 //13int p;14for (p = 0; p <= 23; p++)15{16 Pesgo1.PeData.X[0, p] = p * 10;17 Pesgo1.PeData.Y[0, p] = (float)(-1.0 * (0 + (Math.Sin(p * 0.074) * 60) + (p / 2)));18}19 20// ================================================================21// MANUAL SCALING WITH INVERTED Y AXIS22// ================================================================23// When InvertedYAxis = true, all Y coordinates stay in NEGATIVE24// space. The axis DISPLAYS them as positive. So to show a visible25// range of 0 to 80 on the inverted axis, set ManualMinY/ManualMaxY26// to their negative equivalents:27//28// Displayed axis: 0 (top) ... 80 (bottom)29// Actual values: 0 (top) ... -80 (bottom)30//31Pesgo1.PeGrid.Configure.ManualScaleControlY = ManualScaleControl.MinMax;32Pesgo1.PeGrid.Configure.ManualMinY = -80; // bottom of chart (displays as 80)33Pesgo1.PeGrid.Configure.ManualMaxY = 5; // top of chart (displays as 5)34 35// ================================================================36// GRAPH ANNOTATIONS WITH INVERTED Y AXIS37// ================================================================38// Graph annotation Y coordinates must also be negative, matching39// the actual data space. The axis relabeling is display-only.40//41int aCnt = 0;42 43// Horizontal band from displayed 20 to 40 (actual -20 to -40)44Pesgo1.PeAnnotation.Graph.X[aCnt] = 20; // X start45Pesgo1.PeAnnotation.Graph.Y[aCnt] = -20; // TopLeft Y (negative!)46Pesgo1.PeAnnotation.Graph.Type[aCnt] = (int)GraphAnnotationType.TopLeft;47Pesgo1.PeAnnotation.Graph.Color[aCnt] = Color.Transparent;48Pesgo1.PeAnnotation.Graph.Text[aCnt] = "";49aCnt++;50 51Pesgo1.PeAnnotation.Graph.X[aCnt] = 200; // X end52Pesgo1.PeAnnotation.Graph.Y[aCnt] = -40; // BottomRight Y (negative!)53Pesgo1.PeAnnotation.Graph.Type[aCnt] = (int)GraphAnnotationType.BottomRight;54Pesgo1.PeAnnotation.Graph.Color[aCnt] = Color.Transparent;55Pesgo1.PeAnnotation.Graph.Text[aCnt] = "";56aCnt++;57 58Pesgo1.PeAnnotation.Graph.X[aCnt] = 0;59Pesgo1.PeAnnotation.Graph.Y[aCnt] = 0;60Pesgo1.PeAnnotation.Graph.Type[aCnt] = (int)GraphAnnotationType.RectFill;61Pesgo1.PeAnnotation.Graph.Color[aCnt] = Color.FromArgb(40, 255, 0, 0);62Pesgo1.PeAnnotation.Graph.Text[aCnt] = "";63aCnt++;64 65// Labeled dot at displayed depth 30 (actual Y = -30)66Pesgo1.PeAnnotation.Graph.X[aCnt] = 110;67Pesgo1.PeAnnotation.Graph.Y[aCnt] = -30; // negative!68Pesgo1.PeAnnotation.Graph.Type[aCnt] = (int)GraphAnnotationType.SmallDotSolid;69Pesgo1.PeAnnotation.Graph.Color[aCnt] = Color.FromArgb(255, 200, 0, 0);70Pesgo1.PeAnnotation.Graph.Text[aCnt] = "|fTarget Depth: 30 ft";71aCnt++;72 73Pesgo1.PeAnnotation.Graph.Show = true;74Pesgo1.PeAnnotation.Show = true;75 76// Change Titles and Labels //77Pesgo1.PeString.MainTitle = "Drilling Depth";78Pesgo1.PeString.SubTitle = "";79Pesgo1.PeString.YAxisLabel = "Depth (ft)";80Pesgo1.PeString.XAxisLabel = "Minutes";81 82// Set Various Other Properties //83Pesgo1.PeColor.BitmapGradientMode = true;84Pesgo1.PeColor.QuickStyle = QuickStyle.LightInset;85 86Pesgo1.PeColor.SubsetColors[0] = Color.FromArgb(255, 20, 188, 198);87Pesgo1.PeLegend.SubsetLineTypes[0] = LineType.MediumSolid;88Pesgo1.PePlot.MarkDataPoints = false;89Pesgo1.PeConfigure.PrepareImages = true;90Pesgo1.PeUserInterface.Allow.ZoomStyle = ZoomStyle.Ro2Not;91 92Pesgo1.PePlot.Option.GradientBars = 8;93Pesgo1.PeConfigure.TextShadows = TextShadows.BoldText;96Pesgo1.PeFont.Label.Bold = true;97Pesgo1.PePlot.Option.LineShadows = true;99Pesgo1.PeUserInterface.Scrollbar.ScrollingHorzZoom = true;100Pesgo1.PePlot.Method = SGraphPlottingMethod.PointsPlusLine;101 102// v7.2 new features //103Pesgo1.PePlot.Option.PointGradientStyle = PlotGradientStyle.VerticalAscentInverse;104Pesgo1.PeColor.PointBorderColor = Color.FromArgb(100, 0, 0, 0);105Pesgo1.PePlot.Option.LineSymbolThickness = 3;106Pesgo1.PePlot.Option.AreaBorder = 1;107 108// Set various export defaults //109Pesgo1.PeSpecial.DpiX = 600;110Pesgo1.PeSpecial.DpiY = 600;111 112// default export setting //113Pesgo1.PeUserInterface.Dialog.ExportSizeDef = ExportSizeDef.NoSizeOrPixel;114Pesgo1.PeUserInterface.Dialog.ExportTypeDef = ExportTypeDef.Png;115Pesgo1.PeUserInterface.Dialog.ExportDestDef = ExportDestDef.Clipboard;116Pesgo1.PeUserInterface.Dialog.ExportUnitXDef = "1280";117Pesgo1.PeUserInterface.Dialog.ExportUnitYDef = "768";118Pesgo1.PeUserInterface.Dialog.ExportImageDpi = 300;119 120// v9 features121Pesgo1.PeUserInterface.Cursor.PromptTracking = true;122Pesgo1.PeUserInterface.Cursor.PromptStyle = CursorPromptStyle.XYValues;123Pesgo1.PeUserInterface.Cursor.PromptLocation = CursorPromptLocation.ToolTip;124 125Pesgo1.PeConfigure.RenderEngine = RenderEngine.Direct2D;126Pesgo1.PeConfigure.AntiAliasGraphics = true;127Pesgo1.PeConfigure.AntiAliasText = true;128 129// Generally call ReinitializeResetImage at end **'130Pesgo1.PeFunction.ReinitializeResetImage();131Pesgo1.Invalidate();132// Optionally call Pego1.Refresh() if you are not seeing changes immediatelyTip: Uses property syntax like
Pego1.PeData.Y[s, p]Click underlined properties to view documentation