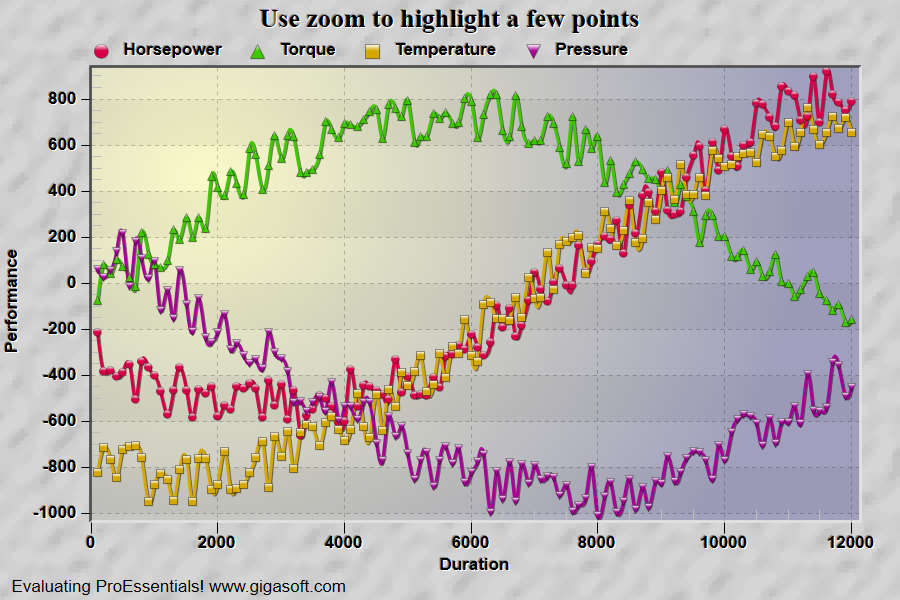
Example 107: Scientific Graph showing rect selector
PesgoScientific Graph Objectadvanced
Rect selector
Form3.cs
1// This example builds upon the basic CreateSimpleSGraph '100' example chart //2CreateSimpleSGraph(Pesgo1);3 4//! Zooming in now draws an ellipse, region of interest //5 6// Enable Rectangle Selector //7Pesgo1.PeUserInterface.Allow.Zooming = AllowZooming.HorzAndVert;8Pesgo1.PeUserInterface.Allow.ZoomLimits = ZoomLimits.AxisSquare;9 10Pesgo1.PeUserInterface.Allow.ZoomInterfaceOnly = ZoomInterfaceOnly.Rect;11Pesgo1.PeUserInterface.Menu.UndoZoom = MenuControl.Hide;12Pesgo1.PeUserInterface.Allow.Maximization = false;13 14// Set properties related to annotations //15Pesgo1.PeUserInterface.Menu.AnnotationControl = true;16Pesgo1.PeAnnotation.Show = true;17Pesgo1.PeFont.GraphAnnotationTextSize = 90;18Pesgo1.PePlot.MarkDataPoints = false;19 20Pesgo1.PeColor.BitmapGradientMode = true;21Pesgo1.PeColor.QuickStyle = QuickStyle.LightInset;23Pesgo1.PeString.MainTitle = "Use zoom to highlight a few points";24Pesgo1.PeFont.SizeGlobalCntl = 1.3f; // make fonts a bit larger25 26// Adding annotation text will attempt to prevent overlapping subsets27Pesgo1.PeAnnotation.Graph.SubsetObstacles[0] = true;28Pesgo1.PeAnnotation.Graph.SubsetObstacles[1] = true;29Pesgo1.PeAnnotation.Graph.SubsetObstacles[2] = true;30Pesgo1.PeAnnotation.Graph.SubsetObstacles[3] = true;31 32// Generally call ReinitializeResetImage at end **'33Pesgo1.PeFunction.ReinitializeResetImage();34Pesgo1.Invalidate();35// Optionally call Pego1.Refresh() if you are not seeing changes immediately36 37/*/////////////////////////////38// Zoom In Event /////////////39//////////////////////////////40private void Pesgo1_PeZoomIn(object sender, System.EventArgs e)41{44 Pesgo1.PeAnnotation.Graph.Type[0] = Convert.ToInt32(GraphAnnotationType.TopLeft);45 48 Pesgo1.PeAnnotation.Graph.Type[1] = Convert.ToInt32(GraphAnnotationType.BottomRight);49 52 Pesgo1.PeAnnotation.Graph.Type[2] = Convert.ToInt32(GraphAnnotationType.EllipseFill);53 Pesgo1.PeAnnotation.Graph.Text[2] = "Region of Interest";54 Pesgo1.PeAnnotation.Graph.GradientStyle[2] = (int) Gigasoft.ProEssentials.Enums.PlotGradientStyle.RadialCentered;55 Pesgo1.PeAnnotation.Graph.GradientColor[2] = Color.FromArgb(5, 255, 255, 255);56 Pesgo1.PeAnnotation.Graph.Color[2] = Color.FromArgb(195, 55, 55, 55);57 Pesgo1.PeAnnotation.Graph.BevelStyle[2] = (int) Gigasoft.ProEssentials.Enums.BevelStyle.ThinSmooth;58 59 Pesgo1.PeFunction.ReinitializeResetImage();60}61*/Tip: Uses property syntax like
Pego1.PeData.Y[s, p]Click underlined properties to view documentation