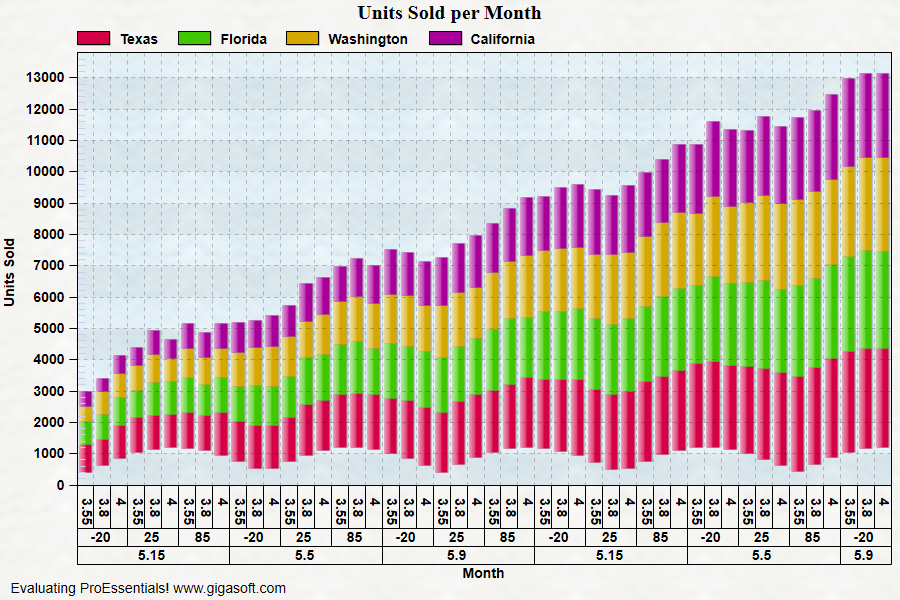
Example 036: Graph showing 2D PointLabels
PegoGraph Objectintermediate
2D PointLabels
Form2.cs
1// This example builds upon the basic CreateSimpleGraph '000' and '025'2// but increases Points to 483 4int s, p;5Pego1.PeUserInterface.Cursor.PromptTracking = true; // v9 uses a tool tip6 7// Enable Bar Glass Effect //8Pego1.PePlot.Option.BarGlassEffect = true;9 10// Enable Plotting style gradient and bevel features //11Pego1.PePlot.Option.AreaGradientStyle = PlotGradientStyle.RadialBottomRight;12Pego1.PePlot.Option.AreaBevelStyle = BevelStyle.MediumSmooth;13Pego1.PePlot.Option.SplineGradientStyle = PlotGradientStyle.RadialBottomRight;14Pego1.PePlot.Option.SplineBevelStyle = SplineBevelStyle.MediumSmooth;15 16Pego1.PePlot.Option.PointGradientStyle = PlotGradientStyle.VerticalAscentInverse;17Pego1.PeColor.PointBorderColor = Color.FromArgb(100, 0, 0, 0);18Pego1.PePlot.Option.LineSymbolThickness = 3;19 20// Prepare images in memory //21Pego1.PeConfigure.PrepareImages = true;22 23// Pass Data //24Pego1.PeData.Subsets = 4;25Pego1.PeData.Points = 48;26 27for (s = 0; s <= 3; s++)28{29 for (p = 0; p <= 47; p++)30 {31 Pego1.PeData.Y[s, p] = ((p + 1) * 50) + ((float)(Rand_Num.NextDouble()) * 250) + 2 + 700.0F - ((s * 140.0F));32 }33}34 35// Set DataShadows to show 3D //36Pego1.PePlot.DataShadows = DataShadows.Shadows;37 38Pego1.PeUserInterface.Allow.FocalRect = false;39Pego1.PePlot.Method = GraphPlottingMethod.Area;40Pego1.PeGrid.LineControl = GridLineControl.Both;42Pego1.PePlot.Allow.Ribbon = true;43Pego1.PeUserInterface.Allow.Zooming = AllowZooming.HorzAndVert;44Pego1.PeUserInterface.Allow.ZoomStyle = ZoomStyle.Ro2Not;45 46// Enable middle mouse dragging //47Pego1.PeUserInterface.Scrollbar.MouseDraggingX = true;48Pego1.PeUserInterface.Scrollbar.MouseDraggingY = true;49 50Pego1.PeString.MainTitle = "Units Sold per Month";51Pego1.PeString.SubTitle = "";52Pego1.PeString.YAxisLabel = "Units Sold";53Pego1.PeString.XAxisLabel = "Month";54 55// subset labels //56Pego1.PeString.SubsetLabels[0] = "Texas";57Pego1.PeString.SubsetLabels[1] = "Florida";58Pego1.PeString.SubsetLabels[2] = "Washington";59Pego1.PeString.SubsetLabels[3] = "California";60 61// subset colors //62Pego1.PeColor.SubsetColors[0] = MainWindow.DemoColors[0];63Pego1.PeColor.SubsetColors[1] = MainWindow.DemoColors[1];64Pego1.PeColor.SubsetColors[2] = MainWindow.DemoColors[2];65Pego1.PeColor.SubsetColors[3] = MainWindow.DemoColors[3];66 67// subset line types //68Pego1.PeLegend.SubsetLineTypes[0] = LineType.MediumSolid;69Pego1.PeLegend.SubsetLineTypes[1] = LineType.MediumSolid;70Pego1.PeLegend.SubsetLineTypes[2] = LineType.MediumSolid;71Pego1.PeLegend.SubsetLineTypes[3] = LineType.MediumSolid;72 73Pego1.PePlot.Option.FixedLineThickness = true; // Direct2D Thick Dashes requires Fixed Thickness to support large resolution74 75// subset point types //76Pego1.PeLegend.SubsetPointTypes[0] = PointType.DotSolid;77Pego1.PeLegend.SubsetPointTypes[1] = PointType.UpTriangleSolid;78Pego1.PeLegend.SubsetPointTypes[2] = PointType.SquareSolid;79Pego1.PeLegend.SubsetPointTypes[3] = PointType.DownTriangleSolid;80 81Pego1.PeLegend.SimplePoint = true;82Pego1.PeLegend.SimpleLine = true;83Pego1.PeLegend.Style = LegendStyle.OneLine;84 85// Allow stacked type graphs //86Pego1.PePlot.Allow.StackedData = true;87 88// Various other features //89Pego1.PeFont.Fixed = true;90Pego1.PeColor.BitmapGradientMode = true;91Pego1.PeColor.QuickStyle = QuickStyle.DarkNoBorder;92 93Pego1.PePlot.Option.GradientBars = 8;94Pego1.PePlot.Option.LineShadows = true;97Pego1.PeFont.Label.Bold = true;98Pego1.PeConfigure.TextShadows = TextShadows.BoldText;100 101Pego1.PeData.Precision = DataPrecision.OneDecimal;102Pego1.PePlot.MarkDataPoints = false;103 104// Done creating basic simple graph showing 48 points105// Next implement floating stacked bars106 107// Enable Stacked type charts //108Pego1.PePlot.Allow.StackedData = true;109 110// Set plotting method //111Pego1.PePlot.Method = GraphPlottingMethod.BarStacked;112 113// Floating stacked Bars are constructed by setting ZData //114for (p = 0; p <= 47; p++)115 Pego1.PeData.Z[0, p] = (float)(System.Math.Abs(System.Math.Sin((0.3 * p)) * 800.0) + 400);116 117// Enable floating stacked bar feature //118Pego1.PePlot.Option.FloatingStackedBars = true;119 120// Set Various Other Properties ///121Pego1.PeColor.BitmapGradientMode = true;122Pego1.PeColor.QuickStyle = QuickStyle.LightLine;123Pego1.PeGrid.LineControl = GridLineControl.Both;125Pego1.PeTable.Show = GraphPlusTable.Graph;126Pego1.PeGrid.InFront = true;127Pego1.PeData.Precision = 0;128Pego1.PePlot.DataShadows = DataShadows.Shadows;129 130// Next implement New v10 Feature 2D PointLabels //131 132// Passing 3 Rows of 48 PointLabelsII133// Duplicate labels will show as one centered label //134// Setting PointLabelsII replaces PointsLabels135// To again show PointLabels, use PeString.PointLabelsII.Clear() to empty PointLabelsII136 137int r = 0; // first row138int c = 0;139for (c = 0; c < 46; c += 3)140{141 Pego1.PeString.PointLabelsII[r, 0 + c] = "3.55"; // New Feature, PeString.PointLabelsII[r,c]142 Pego1.PeString.PointLabelsII[r, 1 + c] = "3.8";143 Pego1.PeString.PointLabelsII[r, 2 + c] = "4";144}145 146r = 1; // second row147for (c = 0; c < 37; c += 9)148{149 Pego1.PeString.PointLabelsII[r, 0 + c] = "-20";150 Pego1.PeString.PointLabelsII[r, 1 + c] = "-20";151 Pego1.PeString.PointLabelsII[r, 2 + c] = "-20";152 153 Pego1.PeString.PointLabelsII[r, 3 + c] = "25";154 Pego1.PeString.PointLabelsII[r, 4 + c] = "25";155 Pego1.PeString.PointLabelsII[r, 5 + c] = "25";156 157 Pego1.PeString.PointLabelsII[r, 6 + c] = "85";158 Pego1.PeString.PointLabelsII[r, 7 + c] = "85";159 Pego1.PeString.PointLabelsII[r, 8 + c] = "85";160}161Pego1.PeString.PointLabelsII[r, 45] = "-20";162Pego1.PeString.PointLabelsII[r, 46] = "-20";163Pego1.PeString.PointLabelsII[r, 47] = "-20";164 165r = 2; // third row166for (c = 0; c < 9; c += 1)167{168 Pego1.PeString.PointLabelsII[r, c] = "5.15";169 Pego1.PeString.PointLabelsII[r, c + 9] = "5.5";170 Pego1.PeString.PointLabelsII[r, c + 18] = "5.9";171 Pego1.PeString.PointLabelsII[r, c + 27] = "5.15";172 Pego1.PeString.PointLabelsII[r, c + 36] = "5.5";173}174Pego1.PeString.PointLabelsII[r, 45] = "5.9";175Pego1.PeString.PointLabelsII[r, 46] = "5.9";176Pego1.PeString.PointLabelsII[r, 47] = "5.9";177 178// Important: AltFreqThreshold set larger than Points, forces all labels vs a frequency of labels.179Pego1.PeGrid.Configure.AltFreqThreshold = 50;180 181Pego1.PePlot.ZoomWindow.Show = true; // testing ZoomWindow and new PointLabelsII feature182Pego1.PePlot.ZoomWindow.ShowXAxis = false; // though likely best to disable x axis within ZoomWindow183 184Pego1.PeUserInterface.HotSpot.Point = true; // hot spots with multiple rows of PointLabelsII185 186Pego1.PeString.GridLineSeparators = true; // New Feature, moves grid lines over half a point187Pego1.PeString.PointLabelsIISeparators = true; // New Feature, extends tick to match pointlabel row188Pego1.PeString.PointLabelsIIBoxed = true; // New Feature, optional box189 190// Done setting PointLabelsII191 192Pego1.PeConfigure.ImageAdjustLeft = 20;193Pego1.PeConfigure.ImageAdjustRight = 20;194Pego1.PeConfigure.ImageAdjustTop = 10;195 196Pego1.PeConfigure.RenderEngine = RenderEngine.Direct2D;197Pego1.PeConfigure.AntiAliasGraphics = true;198Pego1.PeConfigure.AntiAliasText = true;199 200Pego1.PeSpecial.AutoImageReset = true; // Set just because example 17 resets to false201 202Pego1.PeFunction.ReinitializeResetImage();203Pego1.Invalidate();204// Optionally call Pego1.Refresh() if you are not seeing changes immediatelyTip: Uses property syntax like
Pego1.PeData.Y[s, p]Click underlined properties to view documentation