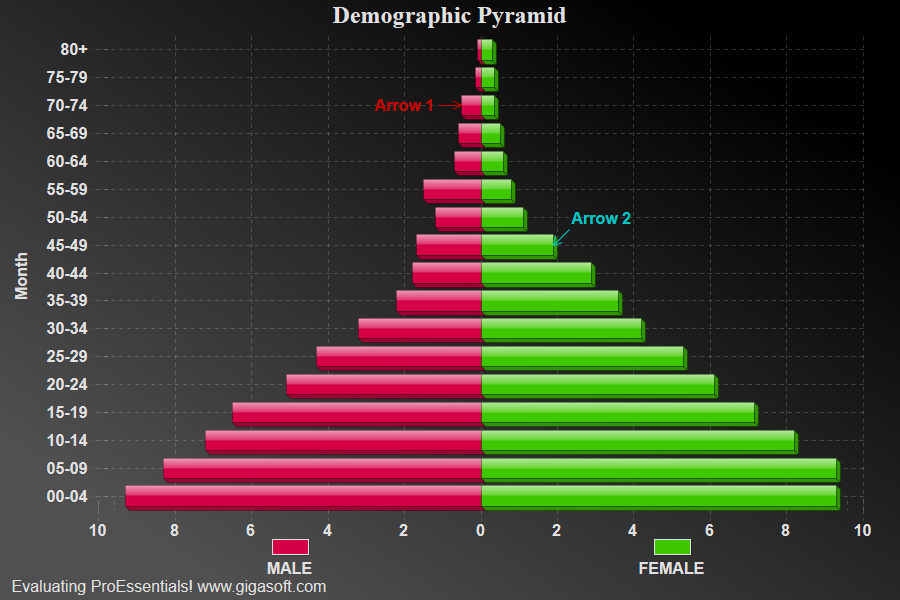
Example 035: Graph showing Demographic Pyramid
PegoGraph Objectintermediate
Demographic Pyramid
Form2.cs
1//! This feature represents a new mode of drawing data and axes, a special case2//! not compatible with mixing plotting styles and full zooming.3//! Best to set AllowPlotCustomization = False, and4//! AllowZooming = PEAZ_NONE or PEAZ_HORIZONTAL.5//! Also note graph annotations take special positioning as demonstrated below.6 7CreateSimpleGraph(Pego1);8 9// Change Data //10Pego1.PeData.Subsets = 2;11Pego1.PeData.Points = 17;12 13// Set Title //14Pego1.PeString.MainTitle = "Demographic Pyramid";15 16// Create some Y Data //23 30 31// Set Subset Labels //32Pego1.PeString.SubsetLabels[0] = "MALE";33Pego1.PeString.SubsetLabels[1] = "FEMALE";34 35// Set Legend to Bottom //36Pego1.PeLegend.Location = LegendLocation.Bottom;37 38// Set Legend Style to Two Line, by default will position next to each half //39Pego1.PeLegend.Style = LegendStyle.TwoLine;40 41// Set Point Labels //42Pego1.PeString.PointLabels[0] = "80+";43Pego1.PeString.PointLabels[1] = "75-79";44Pego1.PeString.PointLabels[2] = "70-74";45Pego1.PeString.PointLabels[3] = "65-69";46Pego1.PeString.PointLabels[4] = "60-64";47Pego1.PeString.PointLabels[5] = "55-59";48Pego1.PeString.PointLabels[6] = "50-54";49Pego1.PeString.PointLabels[7] = "45-49";50Pego1.PeString.PointLabels[8] = "40-44";51Pego1.PeString.PointLabels[9] = "35-39";52Pego1.PeString.PointLabels[10] = "30-34";53Pego1.PeString.PointLabels[11] = "25-29";54Pego1.PeString.PointLabels[12] = "20-24";55Pego1.PeString.PointLabels[13] = "15-19";56Pego1.PeString.PointLabels[14] = "10-14";57Pego1.PeString.PointLabels[15] = "05-09";58Pego1.PeString.PointLabels[16] = "00-04";59 60// Set plotting method //61Pego1.PePlot.Method = GraphPlottingMethod.DemographicPyramid;62 63// Disable incompatible features //64Pego1.PeUserInterface.Allow.Zooming = AllowZooming.None;65Pego1.PeUserInterface.Dialog.PlotCustomization = false;66 67// Auto scaling is supported, and note how manually scaling axes, causes a mirrored effect //68Pego1.PeGrid.Configure.ManualMinY = 0.0;69Pego1.PeGrid.Configure.ManualMaxY = 10.0;70Pego1.PeGrid.Configure.ManualScaleControlY = ManualScaleControl.MinMax;71 72// Place axis on bottom, since horizontal mode, right y axis is bottom y axis //73Pego1.PeGrid.Option.YAxisOnRight = true;74 75// Hide Y axis label //76Pego1.PeGrid.Option.ShowYAxis = ShowAxis.GridNumbers;77 78// Note below how graph annotations are positioned on each side of chart. //79Pego1.PeAnnotation.Graph.X[0] = 3.0;80Pego1.PeAnnotation.Graph.Y[0] = 5 - (Pego1.PeData.Y[0, 2] / 2); // 5 is middle of axis, (10-0) / 2, and note subtracting half81Pego1.PeAnnotation.Graph.Type[0] = (int) Gigasoft.ProEssentials.Enums.GraphAnnotationType.PointerArrowSmall; // of value to position data82Pego1.PeAnnotation.Graph.Text[0] = "Arrow 1";83Pego1.PeAnnotation.Graph.Color[0] = Color.FromArgb(255, 198, 0, 0);84 85Pego1.PeAnnotation.Graph.X[1] = 8.0;86Pego1.PeAnnotation.Graph.Y[1] = 5 + (Pego1.PeData.Y[1, 7] / 2); // 5 is middle of axis, (10-0) / 2, and note adding half87Pego1.PeAnnotation.Graph.Type[1] = (int) Gigasoft.ProEssentials.Enums.GraphAnnotationType.PointerArrowSmall; // of value to position data88Pego1.PeAnnotation.Graph.Text[1] = "Arrow 2";89Pego1.PeAnnotation.Graph.Color[1] = Color.FromArgb(255, 0, 198, 198);90 91Pego1.PeAnnotation.Show = true;92 93// Increase annotation font //94Pego1.PeAnnotation.Graph.TextSize = 100;95 96// Designate subsets obstacles //97Pego1.PeAnnotation.Graph.SubsetObstacles[0] = true;98Pego1.PeAnnotation.Graph.SubsetObstacles[1] = true;99 100// Allow user to move ArrowPointer annotation //101Pego1.PeAnnotation.Graph.Moveable = true;102Pego1.PeUserInterface.HotSpot.GraphAnnotation = AnnotationHotSpot.GraphOnly;103 104// Increase all font sizes //105Pego1.PeFont.SizeGlobalCntl = 1.2F;106 107// No text shadows //108Pego1.PeConfigure.TextShadows = TextShadows.NoShadows;109 110// Set colors //111Pego1.PeColor.BitmapGradientMode = true;112Pego1.PeColor.QuickStyle = QuickStyle.DarkNoBorder;113 114// Make bars 3D //115Pego1.PePlot.DataShadows = DataShadows.ThreeDimensional;116 117Pego1.PeConfigure.RenderEngine = RenderEngine.Direct2D;118Pego1.PeConfigure.AntiAliasGraphics = true;119Pego1.PeConfigure.AntiAliasText = true;120Pego1.PeConfigure.ImageAdjustLeft = 75;121 122Pego1.PeFunction.ReinitializeResetImage();123Pego1.Invalidate();124// Optionally call Pego1.Refresh() if you are not seeing changes immediatelyTip: Uses property syntax like
Pego1.PeData.Y[s, p]Click underlined properties to view documentation