Example 417: 3D WireFrame Contour Colored
Pe3do3D Scientific Objectbeginner
3D WireFrame Contour Colored
Preview
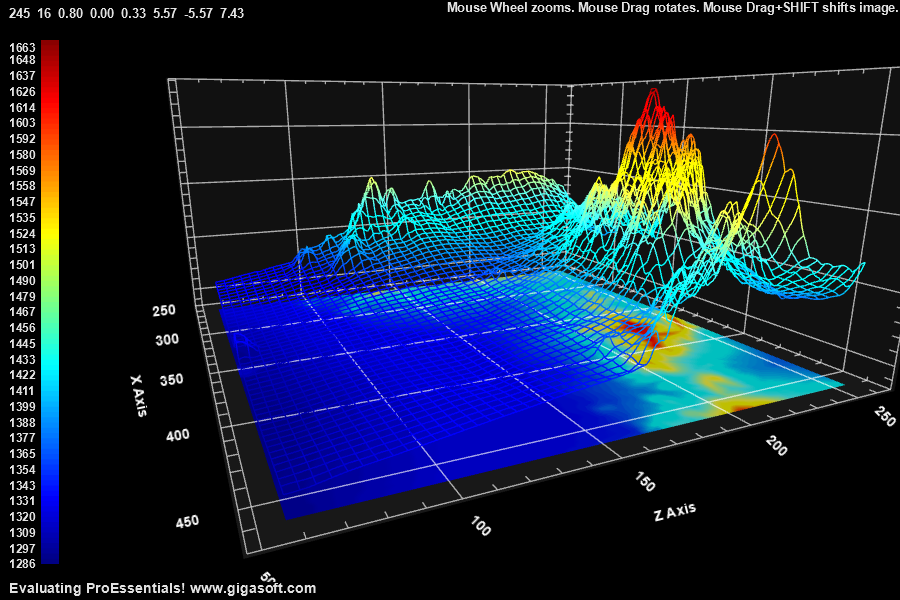
Click to enlarge
Source Code
Form6.cs
1// This example builds upon the basic Create3DSimpleWireframe '400' example chart //2Create3DSimpleWireFrame(Pe3do1);3 4Pe3do1.PePlot.Option.DxFitControlShape = false;5Pe3do1.PeGrid.Option.GridAspectY = 0.5F;6 7Pe3do1.PePlot.Option.WireFrameContourColored = true; // contour color wireframe8Pe3do1.PePlot.Option.WireFrameIsoSubsetPoint = true; // show line topology iso lines instead of render of triangles9Pe3do1.PePlot.Option.WireFrameIsoLineBorders = true; // show iso lines along borders10 11Pe3do1.PePlot.Option.ShowContour = ShowContour.BottomColors; // show a 2D contour along bottom12 13Pe3do1.PePlot.DataShadows = DataShadows.None;14Pe3do1.PeUserInterface.Menu.DataShadow = MenuControl.Show;15 16Pe3do1.PeColor.GridBands = false;17Pe3do1.PeColor.GridBandsPatching = false;18 19Pe3do1.PePlot.Option.DxZoomMax = 3F; // v10 New properties to control max and min, note higher DxFOV means higher Max Min20Pe3do1.PePlot.Option.DxZoomMin = -2F;21 22Pe3do1.PePlot.Option.DxViewportPanFactor = 1.1F; // v10 New properties to control shift/drag and mousewheel sensitivity23Pe3do1.PeUserInterface.Scrollbar.MouseWheelZoomFactor = 3.5F;24 25// Define custom colors for Contour //26Pe3do1.PeColor.SubsetColors.Clear();27Pe3do1.PeColor.SubsetShades.Clear();28for (var colx = 0; colx < 100; ++colx)29{30 var index = (byte)(colx / 100.0 * (MainWindow.MyColors.Length - 1));31 var color = MainWindow.MyColors[index];32 Pe3do1.PeColor.SubsetColors[colx] = color;33 Pe3do1.PeColor.SubsetShades[colx] = Color.FromArgb(255, (byte)(100 + colx), (byte)(100 + colx), (byte)(100 + colx));34}35 36Pe3do1.PeColor.SubsetColors[(int)(SurfaceColors.SolidSurface)] = Color.FromArgb(255, 65, 65, 200);37 38Pe3do1.PeColor.BitmapGradientMode = false;39Pe3do1.PeColor.QuickStyle = QuickStyle.DarkNoBorder;40 41Pe3do1.PeFunction.Force3dxVerticeRebuild = true;42Pe3do1.PeFunction.ReinitializeResetImage();43Pe3do1.Invalidate();44Pe3do1.Refresh();Tip: Uses property syntax like
Pego1.PeData.Y[s, p]Click underlined properties to view documentation