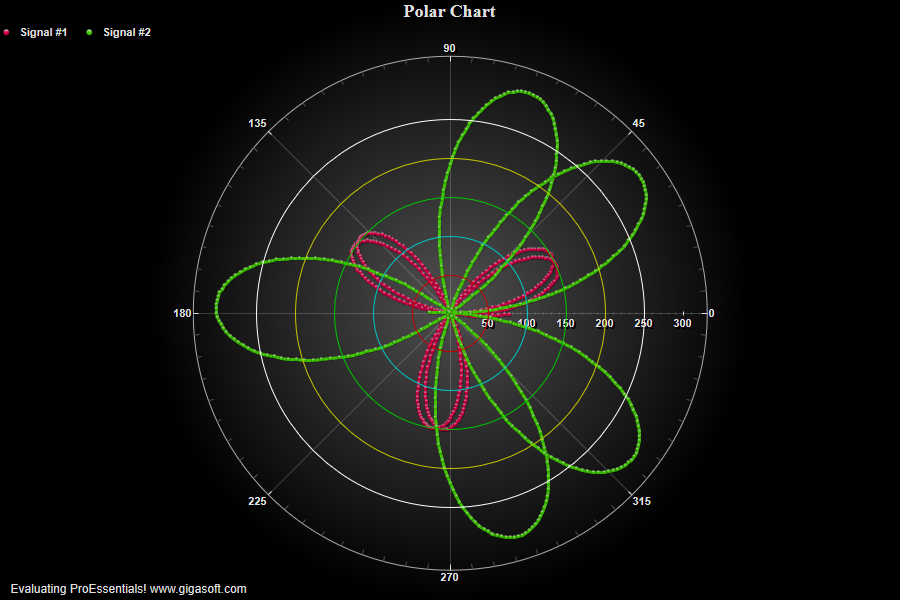
Example 206: Polar Chart showing annotations
PepsoPolar Chart Objectbeginner
Annotations
Form4.cs
1//! Horizontal Line Annotations Plot as Circles //2 3// This example builds upon the basic CreateSimplePolar '200' example chart //4CreateSimplePolar(Pepso1);5 6Pepso1.PeUserInterface.Menu.AnnotationControl = true;7 8Pepso1.PeAnnotation.Line.YAxis[0] = 50;9Pepso1.PeAnnotation.Line.YAxisColor[0] = Color.FromArgb(255, 198, 0, 0);10 11Pepso1.PeAnnotation.Line.YAxis[1] = 100;12Pepso1.PeAnnotation.Line.YAxisColor[1] = Color.FromArgb(255, 0, 198, 198);13 14Pepso1.PeAnnotation.Line.YAxis[2] = 150;15Pepso1.PeAnnotation.Line.YAxisColor[2] = Color.FromArgb(255, 0, 198, 0);16 17Pepso1.PeAnnotation.Line.YAxis[3] = 200;18Pepso1.PeAnnotation.Line.YAxisColor[3] = Color.FromArgb(255, 198, 198, 0);19 20Pepso1.PeAnnotation.Line.YAxis[4] = 250;21Pepso1.PeAnnotation.Line.YAxisColor[4] = Color.FromArgb(255, 255, 255, 255);22 23Pepso1.PeAnnotation.Show = true;24 25// change subset colors //26Pepso1.PeColor.SubsetColors[0] = MainWindow.DemoColors[0];27Pepso1.PeColor.SubsetColors[1] = MainWindow.DemoColors[1];28 29// Only show Degree Grid Lines //30Pepso1.PeGrid.LineControl = GridLineControl.YAxis;31 32Pepso1.PeFunction.ReinitializeResetImage();33Pepso1.Invalidate();Tip: Uses property syntax like
Pego1.PeData.Y[s, p]Click underlined properties to view documentation