English
中文 - Chinese
한국어 - Korean
日本語 - Japanese
Deutsche - German
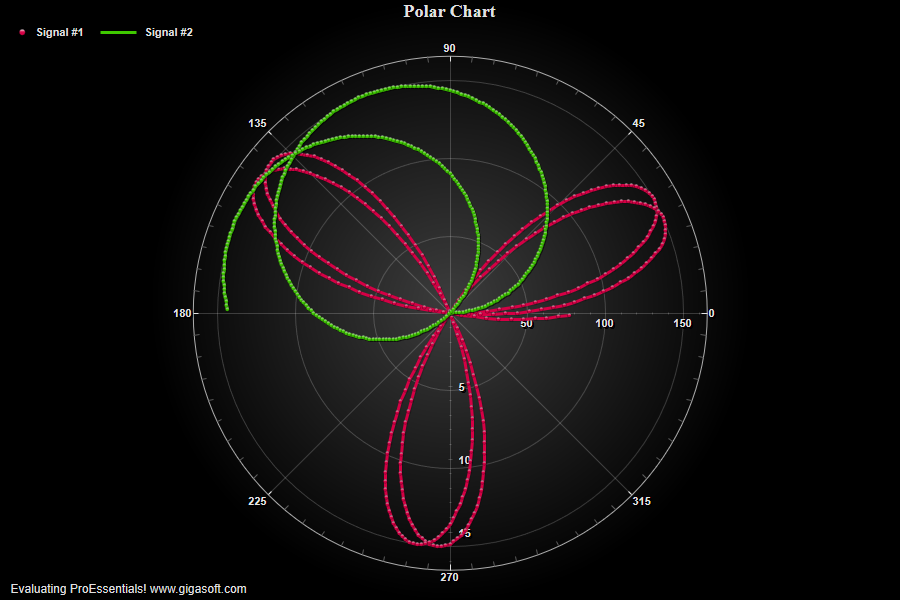
Bi-polar grid
1//! Note there are two radius axes, one horizontal and one vertical //2 3// This example builds upon the basic CreateSimplePolar '200' example chart //4CreateSimplePolar(Pepso1);5 6// Set last subset as a subset to be plotted //7// on a secondary axis //8Pepso1.PePlot.RYAxisComparisonSubsets = 1;9Pepso1.PePlot.MethodII = PSGraphPlottingMethodII.Line;10 11// Set second subset's data to a new range //12for( int p = 0; p <= 359; p++)13{14 Pepso1.PeData.X[1, p] = p;15 Pepso1.PeData.Y[1, p] = (float)(Math.Sin(p * 0.014) * 16.0F);16}17 18// Set Various other features //19Pepso1.PeColor.BitmapGradientMode = true;20Pepso1.PeColor.QuickStyle = QuickStyle.DarkLine;21Pepso1.PeConfigure.BorderTypes = TABorder.NoBorder;22Pepso1.PePlot.PointSize = PointSize.Small;23 24// Add Some Padding on Right and Bottom //25Pepso1.PeConfigure.ImageAdjustLeft = 100;26Pepso1.PeConfigure.ImageAdjustRight = 100;27Pepso1.PeConfigure.ImageAdjustBottom = 100;28 29Pepso1.PeFunction.ReinitializeResetImage();30Pepso1.Invalidate();
Pego1.PeData.Y[s, p]