Example 134: Scientific Graph showing multiple y axes with equally spaced gridlines
PesgoScientific Graph Objectintermediate
Multiple y axes with equally spaced gridlines
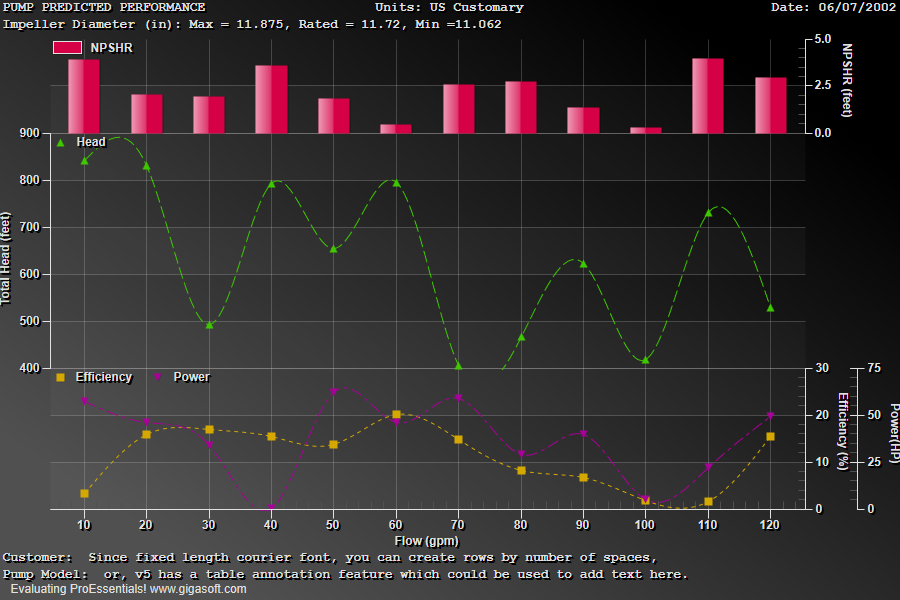
Form3.cs
1//! This example shows a clean approach with multiple left and right y axes2//! where axes have proportional number of y axis grid lines with respect to3//! height of axis. Resulting in equally spaced y axis grid lines across all4//! axes.5 6// v9 features new default CursorPromptLocation = ToolTip7Pesgo1.PeUserInterface.Cursor.PromptTracking = true;8Pesgo1.PeUserInterface.Cursor.PromptLocation = CursorPromptLocation.ToolTip;9Pesgo1.PeUserInterface.Cursor.PromptStyle = CursorPromptStyle.XYValues;10 11//v7.2 new features12Pesgo1.PeGrid.AxisBorders = true;13Pesgo1.PePlot.Option.SolidLineOverArea = 1;14 15// Enable middle mouse dragging //16Pesgo1.PeUserInterface.Scrollbar.MouseDraggingX = true;17Pesgo1.PeUserInterface.Scrollbar.MouseDraggingY = true;18 19// Enable Bar Glass Effect //20Pesgo1.PePlot.Option.BarGlassEffect = true;21 22// Enable Plotting style gradient and bevel features //23Pesgo1.PePlot.Option.AreaGradientStyle = PlotGradientStyle.RadialBottomRight;24Pesgo1.PePlot.Option.AreaBevelStyle = BevelStyle.MediumSmooth;25Pesgo1.PePlot.Option.SplineGradientStyle = PlotGradientStyle.RadialBottomRight;26Pesgo1.PePlot.Option.SplineBevelStyle = SplineBevelStyle.MediumSmooth;27 28Pesgo1.PeData.Subsets = 4;29Pesgo1.PeData.Points = 12;30 31// Change Data to match example scales which are manually configured //32int s, p;33for (s = 0; s <= 3; s++)34{35 for (p = 0; p <= 11; p++)36 {37 Pesgo1.PeData.X[s, p] = (p + 1) * 10.0F;38 39 float f = 0;40 if (s == 0)41 f = (float)(0.01 + (Rand_Num.NextDouble() * 4));42 else if (s == 1)43 f = (float)(400.0 + (Rand_Num.NextDouble() * 450));44 else if (s == 2)45 f = (float)(0.01 + (Rand_Num.NextDouble() * 25));46 else if (s == 3)47 f = (float)(0.01 + (Rand_Num.NextDouble() * 65));48 Pesgo1.PeData.Y[s, p] = f;49 }50}51 52// Now sub-divide subsets into 4 individual axes //53// Each axis with one subset in each //54Pesgo1.PeGrid.MultiAxesSubsets[0] = 1;55Pesgo1.PeGrid.MultiAxesSubsets[1] = 1;56Pesgo1.PeGrid.MultiAxesSubsets[2] = 1;57Pesgo1.PeGrid.MultiAxesSubsets[3] = 1;58 59// Create Overlapped Axes //60Pesgo1.PeGrid.OverlapMultiAxes[0] = 1;61Pesgo1.PeGrid.OverlapMultiAxes[1] = 1;62Pesgo1.PeGrid.OverlapMultiAxes[2] = 2;63 64// Set Proportions of Axes //65Pesgo1.PeGrid.MultiAxesProportions[0] = 0.2F;66Pesgo1.PeGrid.MultiAxesProportions[1] = 0.5F;67Pesgo1.PeGrid.MultiAxesProportions[2] = 0.3F;68 69// Set up First axis parameters //70Pesgo1.PeGrid.WorkingAxis = 0;71Pesgo1.PeGrid.Configure.ManualScaleControlY = ManualScaleControl.MinMax;72Pesgo1.PeGrid.Configure.ManualMinY = 0.0;73Pesgo1.PeGrid.Configure.ManualMaxY = 5.0;74Pesgo1.PeGrid.Configure.ManualYAxisTicknLine = true;75Pesgo1.PeGrid.Configure.ManualYAxisLine = 2.5;76Pesgo1.PeGrid.Configure.ManualYAxisTick = 0.5;77Pesgo1.PeGrid.Option.ShowTickMarkY = ShowTickMarks.TicksHide;78Pesgo1.PeString.YAxisLabel = "NPSHR (feet)";79Pesgo1.PePlot.Method = SGraphPlottingMethod.Bar;80 81// Set up Second axis parameters //82Pesgo1.PeGrid.WorkingAxis = 1;83Pesgo1.PePlot.RYAxisComparisonSubsets = 1;84Pesgo1.PeGrid.Configure.ManualScaleControlRY = ManualScaleControl.MinMax;85Pesgo1.PeGrid.Configure.ManualMinRY = 400;86Pesgo1.PeGrid.Configure.ManualMaxRY = 900;87Pesgo1.PeGrid.Configure.ManualRYAxisTicknLine = true;88Pesgo1.PeGrid.Configure.ManualRYAxisLine = 100.0;89Pesgo1.PeGrid.Configure.ManualRYAxisTick = 20.0;90Pesgo1.PeGrid.Option.ShowTickMarkY = ShowTickMarks.TicksHide;91Pesgo1.PeString.RYAxisLabel = "Total Head (feet)";92Pesgo1.PePlot.MethodII = SGraphPlottingMethodII.PointsPlusSpline;93 94// Set up Third axis parameters //95Pesgo1.PeGrid.WorkingAxis = 2;96Pesgo1.PeGrid.Configure.ManualScaleControlY = ManualScaleControl.MinMax;97Pesgo1.PeGrid.Configure.ManualMinY = 0.0;98Pesgo1.PeGrid.Configure.ManualMaxY = 30.0;99Pesgo1.PeGrid.Configure.ManualYAxisTicknLine = true;100Pesgo1.PeGrid.Configure.ManualYAxisLine = 10.0;101Pesgo1.PeGrid.Configure.ManualYAxisTick = 2.0;102Pesgo1.PeGrid.Option.ShowTickMarkY = ShowTickMarks.TicksHide;103Pesgo1.PeString.YAxisLabel = "Efficiency (%)";104Pesgo1.PePlot.Method = SGraphPlottingMethod.PointsPlusSpline;105 106// Set up Fourth axis parameters //107Pesgo1.PeGrid.WorkingAxis = 3;108Pesgo1.PeGrid.Configure.ManualScaleControlY = ManualScaleControl.MinMax;109Pesgo1.PeGrid.Configure.ManualMinY = 0.0;110Pesgo1.PeGrid.Configure.ManualMaxY = 75.0;111Pesgo1.PeGrid.Configure.ManualYAxisTicknLine = true;112Pesgo1.PeGrid.Configure.ManualYAxisLine = 25.0;113Pesgo1.PeGrid.Configure.ManualYAxisTick = 5.0;114Pesgo1.PeGrid.Option.ShowTickMarkY = ShowTickMarks.TicksHide;115Pesgo1.PeString.YAxisLabel = "Power(HP)";116Pesgo1.PePlot.Method = SGraphPlottingMethod.PointsPlusSpline;117 118// Done Setting Y Axis Parameters, reset WorkingAxis //119Pesgo1.PeGrid.WorkingAxis = 0;120 121// Set various other properties //122Pesgo1.PeGrid.LineControl = GridLineControl.Both;123Pesgo1.PeGrid.Option.MultiAxisStyle = MultiAxisStyle.GroupAllAxes;124Pesgo1.PeLegend.Style = LegendStyle.OneLineInsideOverlap;125 126Pesgo1.PeString.XAxisLabel = "Flow (gpm)";127 128Pesgo1.PeConfigure.BorderTypes = TABorder.SingleLine;129Pesgo1.PeFont.Fixed = true;131Pesgo1.PeString.MainTitle = "";132Pesgo1.PeString.SubTitle = "";134 135Pesgo1.PeFont.SizeMultiSubTitleCntl = 1.1F;136Pesgo1.PeFont.SizeMultiBottomTitleCntl = 1.1F;137 138Pesgo1.PeString.MultiSubTitles[0] = "PUMP PREDICTED PERFORMANCE|Units: US Customary|Date: 06/07/2002";139Pesgo1.PeString.MultiSubTitles[1] = "Impeller Diameter (in): Max = 11.875, Rated = 11.72, Min =11.062||";140 141Pesgo1.PeString.MultiBottomTitles[1] = "Customer: Since fixed length courier font, you can create rows by number of spaces, ||";142Pesgo1.PeString.MultiBottomTitles[0] = "Pump Model: or, v5 has a table annotation feature which could be used to add text here. ||";143 144Pesgo1.PeGrid.Option.YAxisOnRight = true;145 146Pesgo1.PeString.SubsetLabels[0] = "NPSHR";147Pesgo1.PeString.SubsetLabels[1] = "Head";148Pesgo1.PeString.SubsetLabels[2] = "Efficiency";149Pesgo1.PeString.SubsetLabels[3] = "Power";150 151Pesgo1.PeUserInterface.Menu.MultiAxisStyle = MenuControl.Show;152Pesgo1.PePlot.DataShadows = DataShadows.None;153Pesgo1.PeUserInterface.Allow.Zooming = AllowZooming.HorzAndVert;154Pesgo1.PeUserInterface.Allow.ZoomStyle = ZoomStyle.Ro2Not;155 156Pesgo1.PeLegend.SimpleLine = true;157Pesgo1.PeLegend.SimplePoint = true;158 159Pesgo1.PeColor.SubsetColors[0] = MainWindow.DemoColors[0];160Pesgo1.PeColor.SubsetColors[1] = MainWindow.DemoColors[1];161Pesgo1.PeColor.SubsetColors[2] = MainWindow.DemoColors[2];162Pesgo1.PeColor.SubsetColors[3] = MainWindow.DemoColors[3];163 164Pesgo1.PeColor.BitmapGradientMode = true;165Pesgo1.PeColor.QuickStyle = QuickStyle.DarkNoBorder;166 167Pesgo1.PeConfigure.TextShadows = TextShadows.BoldText;170Pesgo1.PeFont.Label.Bold = true;172Pesgo1.PePlot.DataShadows = DataShadows.Shadows;173Pesgo1.PePlot.Option.GradientBars = 8;174 175// Set various export defaults //176Pesgo1.PeSpecial.DpiX = 600;177Pesgo1.PeSpecial.DpiY = 600;178 179// default export setting //180Pesgo1.PeUserInterface.Dialog.ExportSizeDef = ExportSizeDef.NoSizeOrPixel;181Pesgo1.PeUserInterface.Dialog.ExportTypeDef = ExportTypeDef.Png;182Pesgo1.PeUserInterface.Dialog.ExportDestDef = ExportDestDef.Clipboard;183Pesgo1.PeUserInterface.Dialog.ExportUnitXDef = "1280";184Pesgo1.PeUserInterface.Dialog.ExportUnitYDef = "768";185Pesgo1.PeUserInterface.Dialog.ExportImageDpi = 300;186 187Pesgo1.PeConfigure.RenderEngine = RenderEngine.Direct2D;188Pesgo1.PeConfigure.AntiAliasGraphics = true;189Pesgo1.PeConfigure.AntiAliasText = true;190 191// Generally call ReinitializeResetImage at end **'192Pesgo1.PeFunction.ReinitializeResetImage();193Pesgo1.Invalidate();194// Optionally call Pesgo1.Refresh() if you are not seeing changes immediatelyTip: Uses property syntax like
Pego1.PeData.Y[s, p]Click underlined properties to view documentation