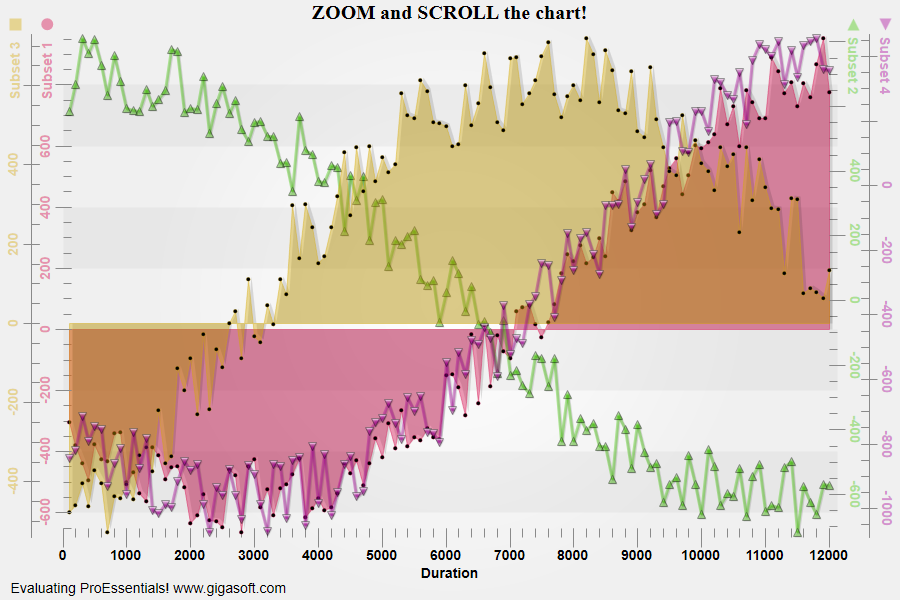
Example 129: Scientific Graph showing vertical y axis grid numbers
PesgoScientific Graph Objectintermediate
Vertical y axis grid numbers
Form3.cs
1//! Vertical Y Axis Grid Numbers and Special Y Axis Grid Label Locations //2//! Try Zooming and Scrolling vertically. //3 4//! This feature is ideally suited for using many left and/or right y axes. //5//! It's also handy when screen real-estate is limited as it always is. //6 7// This example builds upon the basic CreateSimpleSGraph '100' example chart //8CreateSimpleSGraph(Pesgo1);9 10// subset colors with alpha //11Pesgo1.PeColor.SubsetColors[0] = MainWindow.aDemoColors[0];12Pesgo1.PeColor.SubsetColors[1] = MainWindow.aDemoColors[1];13Pesgo1.PeColor.SubsetColors[2] = MainWindow.aDemoColors[2];14Pesgo1.PeColor.SubsetColors[3] = MainWindow.aDemoColors[3];15 16// Seperate subsets into separate axes ///17Pesgo1.PeGrid.MultiAxesSubsets[0] = 2;18Pesgo1.PeGrid.MultiAxesSubsets[1] = 2;19// Overlap both multi axes ///20Pesgo1.PeGrid.OverlapMultiAxes[0] = 2;21 22Pesgo1.PeUserInterface.Allow.MultiAxesSizing = true;23 24// Set Vertical Grid Numbers //25Pesgo1.PeGrid.Option.YAxisVertGridNumbers = true;26Pesgo1.PeGrid.Option.VgnAxisLabelLocation = true;27Pesgo1.PeString.TextShadows = TextShadows.NoShadows;28 29// First Multi Axes //30Pesgo1.PeGrid.WorkingAxis = 0;31Pesgo1.PePlot.RYAxisComparisonSubsets = 1; // First multi axes, set second subset on right //32 33Pesgo1.PePlot.Method = SGraphPlottingMethod.Area;34Pesgo1.PePlot.MethodII = SGraphPlottingMethodII.PointsPlusLine;35 36Pesgo1.PeColor.YAxis = Pesgo1.PeColor.SubsetColors[0];37Pesgo1.PeString.YAxisLabel = "Subset 1|4"; // |4 is equivalent of PEGAT_DOTSOLID38 39Pesgo1.PeColor.RYAxis = Pesgo1.PeColor.SubsetColors[1];40Pesgo1.PeString.RYAxisLabel = "Subset 2|10"; // |10 is equivalent of PEGAT_UPTRIANGLESOLID41 42Pesgo1.PeGrid.Option.ShowYAxis = ShowAxis.GridNumbers;43Pesgo1.PeGrid.Option.ShowRYAxis = ShowAxis.GridNumbers;44 45Pesgo1.PeGrid.WorkingAxis = 1;46Pesgo1.PePlot.RYAxisComparisonSubsets = 1;47 48// Second Multi Axes //49Pesgo1.PeGrid.WorkingAxis = 1;50Pesgo1.PePlot.RYAxisComparisonSubsets = 1; // Second multi axes, set second subset on right //51 52Pesgo1.PePlot.Method = SGraphPlottingMethod.Area;53Pesgo1.PePlot.MethodII = SGraphPlottingMethodII.PointsPlusLine;54 55Pesgo1.PeColor.YAxis = Pesgo1.PeColor.SubsetColors[2];56Pesgo1.PeString.YAxisLabel = "Subset 3|6"; // |6 is equivalent of PEGAT_SQUARESOLID57 58Pesgo1.PeColor.RYAxis = Pesgo1.PeColor.SubsetColors[3];59Pesgo1.PeString.RYAxisLabel = "Subset 4|12"; // |12 is equivalent of PEGAT_DOWNTRIANGLESOLID60 61Pesgo1.PeGrid.Option.ShowYAxis = ShowAxis.GridNumbers;62Pesgo1.PeGrid.Option.ShowRYAxis = ShowAxis.GridNumbers;63 64Pesgo1.PeGrid.WorkingAxis = 0;65 66Pesgo1.PeLegend.Show = false; // No need for legend, we've placed legend along axes67 68// Set Various Other Properties ///69Pesgo1.PeColor.BitmapGradientMode = true;70Pesgo1.PeColor.QuickStyle = QuickStyle.LightNoBorder;71Pesgo1.PeGrid.LineControl = GridLineControl.None;72Pesgo1.PePlot.MarkDataPoints = true;74Pesgo1.PePlot.Option.BestFitDegree = BestFitDegree.Fourth;75 76Pesgo1.PeUserInterface.Scrollbar.ScrollingVertZoom = true;77Pesgo1.PeUserInterface.Scrollbar.ScrollingHorzZoom = true;78 79Pesgo1.PeColor.TickColor = Color.FromArgb(0, 1, 0, 0); // Empty equiv Color.Empty;80Pesgo1.PeString.MainTitle = "ZOOM and SCROLL the chart!";81 82Pesgo1.PePlot.Option.AreaGradientStyle = PlotGradientStyle.NoGradient;83 84Pesgo1.PeConfigure.ImageAdjustLeft = 50;85Pesgo1.PeConfigure.ImageAdjustRight = 50;86 87// Generally call ReinitializeResetImage at end **'88Pesgo1.PeFunction.ReinitializeResetImage();89Pesgo1.Invalidate();90// Optionally call Pesgo1.Refresh() if you are not seeing changes immediatelyTip: Uses property syntax like
Pego1.PeData.Y[s, p]Click underlined properties to view documentation