Example 120: Scientific Graph showing 2D contour colors
PesgoScientific Graph Objectadvanced
2D contour colors
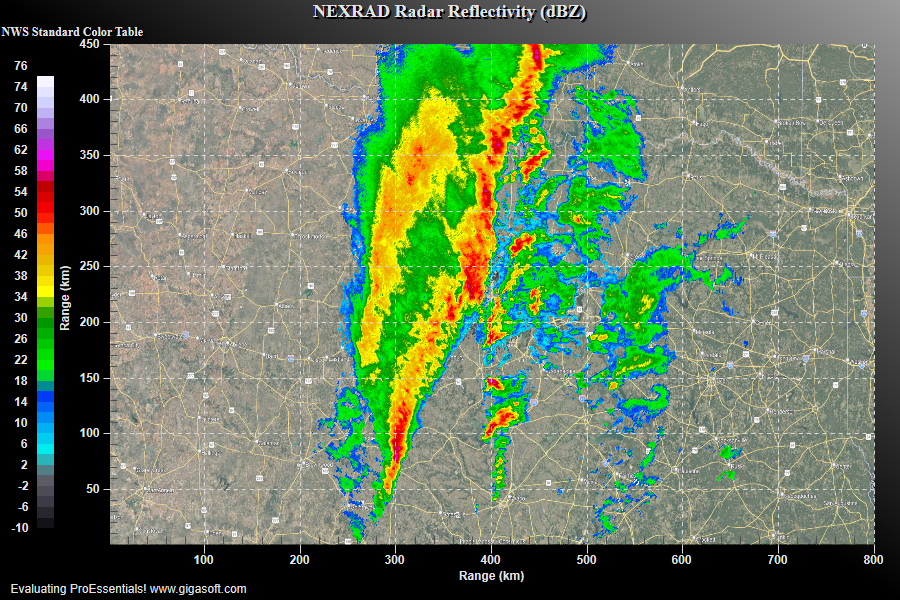
Form3.cs
1 //! Right button click to show popup menu. //2 //! Double Click to show customization dialog. //3 //! Left-Click and drag to draw zoom box. Use popup memu or 'z' to undo zoom. //4 5 // =============================================================6 // NEXRAD Radar Reflectivity - Contour Chart7 // NWS-Standard Color Table (Classic TV Weather Radar)8 // Builds on CreateSimpleSGraph(Pesgo1) base.9 // =============================================================10 // Binary file: sweep_ref_800x450.bin11 // - 1,440,000 bytes = 800 x 450 little-endian float3212 // - Row-major: first 800 floats = row 0, next 800 = row 1, etc.13 // - Values: dBZ reflectivity, range approx -6 to 7514 // =============================================================15 16 Pesgo1.PeUserInterface.Scrollbar.MouseDraggingX = true;17 Pesgo1.PeUserInterface.Scrollbar.MouseDraggingY = true;18 19 int nSubsets = 450; // grid rows (Y dimension)20 int nPoints = 800; // grid columns (X dimension)21 int nTotal = nSubsets * nPoints;22 23 Pesgo1.PeData.Subsets = nSubsets;24 Pesgo1.PeData.Points = nPoints;25 26 // --- Load binary reflectivity data into Z ---27 float[] pMyZData = new float[nTotal];28 string binPath = System.IO.Path.Combine(29 AppDomain.CurrentDomain.BaseDirectory,30 "sweep_ref_800x450.bin");31 32 System.IO.FileStream fs = null;33 try34 {35 fs = new System.IO.FileStream(binPath, System.IO.FileMode.Open);36 }37 catch38 {39 System.Windows.Forms.MessageBox.Show("sweep_ref_800x450.bin Not Found?",40 "Error", System.Windows.Forms.MessageBoxButtons.OK);41 System.Windows.Forms.Application.Exit();42 }43 System.IO.BinaryReader reader = new System.IO.BinaryReader(fs);44 for (int i = 0; i < nTotal; i++)45 pMyZData[i] = reader.ReadSingle();46 fs.Close();47 48 // --- Build 1D X and Y coordinate arrays ---49 float[] pMyXData = new float[nPoints];50 float[] pMyYData = new float[nSubsets];51 {52 for (int p = 0; p < nPoints; p++)53 pMyXData[p] = (float)(p + 1);54 for (int s2 = 0; s2 < nSubsets; s2++)55 pMyYData[s2] = (float)(s2 + 1);56 }57 // Important: set DuplicateData BEFORE FastCopyFrom58 Pesgo1.PeData.DuplicateDataX = DuplicateData.PointIncrement;59 Pesgo1.PeData.DuplicateDataY = DuplicateData.SubsetIncrement;60 61 // Transfer data62 Pesgo1.PeData.X.FastCopyFrom(pMyXData, nPoints);63 Pesgo1.PeData.Y.FastCopyFrom(pMyYData, nSubsets);64 Pesgo1.PeData.Z.FastCopyFrom(pMyZData, nTotal);65 66 // Tell PE that -999 means "no data" for the Z (contour) array67 Pesgo1.PeData.NullDataValueZ = -999.0;68 69 // =============================================================70 // NWS WSR-88D Standard Radar Reflectivity Color Table71 // Classic TV weather radar look:72 // dark < teal < blue < green < yellow < orange < red73 // dark-red < magenta < purple < white74 //75 // 43 bands x 2 dBZ each, covering -10 to 76 dBZ76 // Anchor colors defined at key dBZ thresholds, linearly77 // interpolated between anchors for smooth band gradients.78 // =============================================================79 80 // Optionally to manually create a contour scale independent of data //81 // As data changes between various charts, the scale remains the same. //82 // or for example, Lock the contour scale to exact dBZ range83 Pesgo1.PeGrid.Configure.ManualScaleControlZ = ManualScaleControl.MinMax;84 Pesgo1.PeGrid.Configure.ManualMinZ = -10.0F;85 Pesgo1.PeGrid.Configure.ManualMaxZ = 76.0F;86 87 // Defining SubsetColors is the recommend approach for controlling color for 2D Contours88 89 // NWS anchor colors at key dBZ thresholds90 // Each row: { dBZ, R, G, B }91 int[,] anchors = {92 { -10, 8, 8, 12 }, // Below threshold - near black93 { -5, 60, 60, 72 }, // Noise floor - dark gray-blue94 { 0, 100, 100, 110 }, // Minimal return - gray95 { 5, 0, 236, 236 }, // Very light precip - bright cyan96 { 10, 1, 160, 246 }, // Light precip - medium blue97 { 15, 0, 60, 246 }, // Light-moderate - dark blue98 { 20, 0, 255, 0 }, // Moderate rain - bright green99 { 25, 0, 200, 0 }, // Moderate rain - medium green100 { 30, 0, 139, 0 }, // Heavy rain - dark green101 { 35, 255, 255, 0 }, // Very heavy - bright yellow102 { 40, 231, 192, 0 }, // Intense - dark yellow / gold103 { 45, 255, 144, 0 }, // Very intense - orange104 { 50, 255, 0, 0 }, // Severe - bright red105 { 55, 190, 0, 0 }, // Severe - dark red106 { 60, 255, 0, 255 }, // Extreme - magenta107 { 65, 153, 85, 201 }, // Extreme - purple108 { 70, 200, 200, 255 }, // Max - lavender-white109 { 76, 255, 255, 255 }, // Ceiling - white110};111 112 int nAnchors = anchors.GetLength(0);113 int nColors = 43; // 43 bands x 2 dBZ = 86 dBZ span (-10 to 76)114 float dBZMin = -10.0F;115 float dBZMax = 76.0F;116 float dBZStep = (dBZMax - dBZMin) / nColors;117 118 Pesgo1.PeColor.SubsetColors.Clear();119 120 for (int c = 0; c < nColors; c++)121 {122 float dBZ = dBZMin + (c + 0.5F) * dBZStep; // midpoint of band123 124 // Find surrounding anchor pair for interpolation125 int lo = 0, hi = 1;126 for (int a = 0; a < nAnchors - 1; a++)127 {128 if (dBZ >= anchors[a, 0] && dBZ <= anchors[a + 1, 0])129 {130 lo = a;131 hi = a + 1;132 break;133 }134 if (a == nAnchors - 2) { lo = a; hi = a + 1; }135 }136 137 // Linear interpolation between anchor colors138 float span = anchors[hi, 0] - anchors[lo, 0];139 float t = (span > 0) ? (dBZ - anchors[lo, 0]) / span : 0;140 t = Math.Max(0, Math.Min(1, t));141 142 int r = (int)(anchors[lo, 1] + t * (anchors[hi, 1] - anchors[lo, 1]));143 int g = (int)(anchors[lo, 2] + t * (anchors[hi, 2] - anchors[lo, 2]));144 int b = (int)(anchors[lo, 3] + t * (anchors[hi, 3] - anchors[lo, 3]));145 r = Math.Max(0, Math.Min(255, r));146 g = Math.Max(0, Math.Min(255, g));147 b = Math.Max(0, Math.Min(255, b));148 149 Pesgo1.PeColor.SubsetColors[c] = Color.FromArgb(255, (byte)r, (byte)g, (byte)b);150 }151 152 // SubsetShades: darker version of each color for contour shadow lines153 Pesgo1.PeColor.SubsetShades.Clear();154 for (int c = 0; c < nColors; c++)155 {156 Color sc = Pesgo1.PeColor.SubsetColors[c];157 int dr = (int)(sc.R * 0.55);158 int dg = (int)(sc.G * 0.55);159 int db = (int)(sc.B * 0.55);160 Pesgo1.PeColor.SubsetShades[c] = Color.FromArgb(255, (byte)dr, (byte)dg, (byte)db);161 }162 163 // --- Legend ---164 Pesgo1.PeLegend.ContourLegendPrecision = ContourLegendPrecision.ZeroDecimals;165 Pesgo1.PeLegend.ContourStyle = true;166 Pesgo1.PeLegend.Location = LegendLocation.Left;167 168 // --- Visual style ---169 Pesgo1.PeColor.BitmapGradientMode = true;170 Pesgo1.PeColor.QuickStyle = QuickStyle.DarkShadow;171 Pesgo1.PeConfigure.BorderTypes = TABorder.NoBorder;172 Pesgo1.PeColor.GridBold = true;173 174 // --- Plotting method ---175 Pesgo1.PePlot.Allow.ContourColors = true;176 Pesgo1.PePlot.Allow.ContourColorsShadows = true;177 Pesgo1.PePlot.Method = SGraphPlottingMethod.ContourColors;178 Pesgo1.PeUserInterface.Menu.DataShadow = MenuControl.Hide;179 180 // --- Grid ---181 Pesgo1.PeGrid.InFront = true;182 Pesgo1.PeGrid.LineControl = GridLineControl.Both;184 Pesgo1.PeGrid.GridBands = false;185 Pesgo1.PeGrid.Configure.AutoMinMaxPadding = 0;186 187 // --- Performance ---188 Pesgo1.PeConfigure.PrepareImages = true;189 Pesgo1.PeConfigure.CacheBmp = true;190 191 // --- Zoom and scroll ---192 Pesgo1.PeUserInterface.Allow.ZoomStyle = ZoomStyle.Ro2Not;193 Pesgo1.PeUserInterface.Allow.Zooming = AllowZooming.HorzAndVertMb;194 Pesgo1.PeUserInterface.Scrollbar.MouseWheelFunction = MouseWheelFunction.HorizontalVerticalZoom;195 Pesgo1.PeUserInterface.Scrollbar.MouseWheelZoomSmoothness = 3;196 Pesgo1.PeUserInterface.Scrollbar.MouseWheelZoomFactor = 1.2F;197 Pesgo1.PeUserInterface.Scrollbar.ScrollingVertZoom = true;198 Pesgo1.PeUserInterface.Scrollbar.ScrollingHorzZoom = true;199 200 // --- Disable non-contour plotting methods ---201 Pesgo1.PePlot.Allow.Line = false;202 Pesgo1.PePlot.Allow.Point = false;203 Pesgo1.PePlot.Allow.Bar = false;204 Pesgo1.PePlot.Allow.Area = false;205 Pesgo1.PePlot.Allow.Spline = false;206 Pesgo1.PePlot.Allow.SplineArea = false;207 Pesgo1.PePlot.Allow.PointsPlusLine = false;208 Pesgo1.PePlot.Allow.PointsPlusSpline = false;209 Pesgo1.PePlot.Allow.BestFitCurve = false;210 Pesgo1.PePlot.Allow.BestFitLine = false;211 Pesgo1.PePlot.Allow.Stick = false;212 213 // --- Titles ---214 Pesgo1.PeString.MainTitle = "NEXRAD Radar Reflectivity (dBZ)";215 Pesgo1.PeString.SubTitle = "NWS Standard Color Table | 800x450 Grid";216 Pesgo1.PeString.YAxisLabel = "Range (km)";217 Pesgo1.PeString.XAxisLabel = "Range (km)";218 219 // --- Font ---221 Pesgo1.PeFont.Fixed = true;222 Pesgo1.PeConfigure.TextShadows = TextShadows.BoldText;225 Pesgo1.PeFont.Label.Bold = true;226 227 // --- Disable inappropriate dialog tabs ---228 Pesgo1.PeUserInterface.Dialog.Axis = false;229 Pesgo1.PeUserInterface.Dialog.Style = false;230 Pesgo1.PeUserInterface.Dialog.Subsets = false;231 232 // --- Cursor tracking ---233 Pesgo1.PeUserInterface.Cursor.PromptTracking = true;234 Pesgo1.PeUserInterface.Cursor.PromptStyle = CursorPromptStyle.XYZValues;235 Pesgo1.PeUserInterface.Cursor.PromptLocation = CursorPromptLocation.Text;236 Pesgo1.PeUserInterface.Cursor.HourGlassThreshold = 9999999;237 238 // --- Background map image ---239 Pesgo1.PeColor.GraphBmpAlways = true;240 Pesgo1.PeColor.GraphGradientStyle = GradientStyle.Horizontal;241 Pesgo1.PeColor.GraphGradientStart = Color.FromArgb(255, 255, 255, 255);242 Pesgo1.PeColor.GraphGradientEnd = Color.FromArgb(255, 255, 255, 255);243 Pesgo1.PeColor.GraphBackground = Color.Empty;244 Pesgo1.PeColor.GraphBmpFilename = "radar_background.png";245 Pesgo1.PeColor.GraphBmpStyle = BitmapStyle.BitBltZooming;246 Pesgo1.PeColor.GraphBmpOpacity = 70;247 // optionally control the relationship between the BitBltZooming zoomable background bitmap and the data units.248 //Pesgo1.PeGrid.Configure.GraphBmpMinX = fsomeMinX;249 //Pesgo1.PeGrid.Configure.GraphBmpMaxX = fsomeMaxX;250 //Pesgo1.PeGrid.Configure.GraphBmpMinY = fsomeMinY;251 //Pesgo1.PeGrid.Configure.GraphBmpMaxY = fsomeMaxY;252 253 // --- Export defaults ---254 Pesgo1.PeSpecial.DpiX = 600;255 Pesgo1.PeSpecial.DpiY = 600;256 Pesgo1.PeUserInterface.Dialog.ExportSizeDef = ExportSizeDef.NoSizeOrPixel;257 Pesgo1.PeUserInterface.Dialog.ExportTypeDef = ExportTypeDef.Png;258 Pesgo1.PeUserInterface.Dialog.ExportDestDef = ExportDestDef.Clipboard;259 Pesgo1.PeUserInterface.Dialog.ExportUnitXDef = "1280";260 Pesgo1.PeUserInterface.Dialog.ExportUnitYDef = "768";261 Pesgo1.PeUserInterface.Dialog.ExportImageDpi = 300;262 Pesgo1.PeUserInterface.Dialog.AllowEmfExport = false;263 Pesgo1.PeUserInterface.Dialog.AllowWmfExport = false;264 265 266 Pesgo1.PeUserInterface.HotSpot.Data = true; // try both ways true and false;267 Pesgo1.PeUserInterface.Cursor.PromptTracking = true;268 Pesgo1.PeUserInterface.Cursor.PromptStyle = CursorPromptStyle.ZValue;269 270 Pesgo1.PeUserInterface.Cursor.TrackingTooltipTitle = "USA Dallas area";271 Pesgo1.PeUserInterface.Cursor.PromptLocation = CursorPromptLocation.ToolTip;272 Pesgo1.PeUserInterface.Cursor.TrackingCustomDataText = true;273 Pesgo1.PeUserInterface.Cursor.Hand = (int)Gigasoft.ProEssentials.Enums.MouseCursorStyles.Arrow;274 275 276 // --- Rendering: Direct3D required for 2D contour ---277 Pesgo1.PeConfigure.Composite2D3D = Composite2D3D.Foreground;278 Pesgo1.PeConfigure.RenderEngine = RenderEngine.Direct3D;279 Pesgo1.PeData.ComputeShader = true;280 Pesgo1.PeFunction.Force3dxNewColors = true;281 Pesgo1.PeFunction.Force3dxVerticeRebuild = true;282 Pesgo1.PeConfigure.AntiAliasGraphics = true;283 284 // --- Finalize ---285 Pesgo1.PeFunction.ReinitializeResetImage();286 Pesgo1.Invalidate();287 288/*289///////////////290// MouseMove //291///////////////292System.Drawing.Rectangle rect = Pesgo1.PeFunction.GetRectGraph();293 294// get last mouse location within control //'295System.Drawing.Point pt = Pesgo1.PeUserInterface.Cursor.LastMouseMove;296 297if (rect.Contains(pt))298{299 if (Pesgo1.PeUserInterface.HotSpot.Data == false)300 {301 this.Text = "Interpolated Z: " + String.Format("{0:0.000}", Pesgo1.PeUserInterface.Cursor.CursorValueZ);302 }303 else304 {305 Gigasoft.ProEssentials.Structs.HotSpotData ds = Pesgo1.PeFunction.GetHotSpot();306 if (ds.Type == HotSpotType.DataPoint)307 {308 this.Text = "Z Data: " + Pesgo1.PeData.Z[ds.Data1, ds.Data2].ToString();309 }310 }311}312 313//////////////////////////////314// PeCustomTrackingDataText //315//////////////////////////////316string s;317s = String.Format("X : {0:0.00} \n", Pesgo1.PeUserInterface.Cursor.CursorValueX);318s += String.Format("Y : {0:0.00} \n", Pesgo1.PeUserInterface.Cursor.CursorValueY);319s += String.Format("Z : {0:0.00} ", Pesgo1.PeUserInterface.Cursor.CursorValueZ);320e.TrackingText = s;321 322*/Tip: Uses property syntax like
Pego1.PeData.Y[s, p]Click underlined properties to view documentation