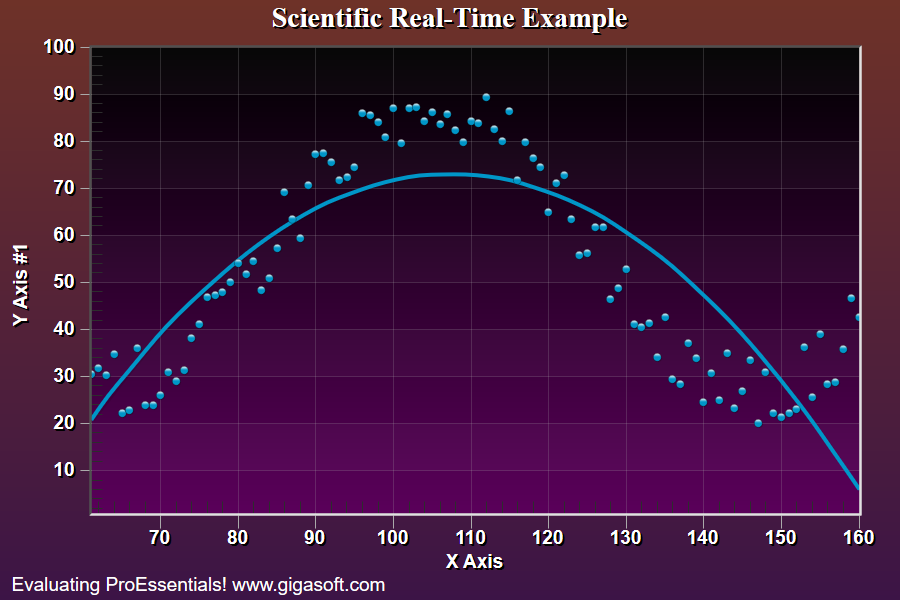
Example 116: Scientific Graph showing real-time 2
PesgoScientific Graph Objectadvanced
Real-time 2
Form3.cs
1//! Chart fills 100 points autoscaling x axis is it2//! is filled. Once 100 point have been passed, the3//! chart then acts as a strip chart.4 5Pesgo1.PeData.Subsets = 1;6Pesgo1.PeData.Points = 100;7 8// Set Manual Y scale //9Pesgo1.PeGrid.Configure.ManualScaleControlY = ManualScaleControl.MinMax;10Pesgo1.PeGrid.Configure.ManualMinY = 1;11Pesgo1.PeGrid.Configure.ManualMaxY = 100;12 13// Clear out default data //14Pesgo1.PeData.X[0, 0] = 0;15Pesgo1.PeData.X[0, 1] = 0;16Pesgo1.PeData.X[0, 2] = 0;17Pesgo1.PeData.X[0, 3] = 0;18Pesgo1.PeData.Y[0, 0] = 0;19Pesgo1.PeData.Y[0, 1] = 0;20Pesgo1.PeData.Y[0, 2] = 0;21Pesgo1.PeData.Y[0, 3] = 0;22 23// Set Various Other Properties ///24Pesgo1.PeColor.BitmapGradientMode = true;25Pesgo1.PeColor.QuickStyle = QuickStyle.DarkInset;26 27// Set various properties //28Pesgo1.PeString.MainTitle = "Scientific Real-Time Example";29Pesgo1.PeString.SubTitle = "";30Pesgo1.PeUserInterface.Dialog.RandomPointsToExport = true;31Pesgo1.PeUserInterface.Allow.FocalRect = false;32Pesgo1.PePlot.Allow.Bar = false;33Pesgo1.PeUserInterface.Allow.Popup = false;34Pesgo1.PeConfigure.PrepareImages = true;35Pesgo1.PeConfigure.CacheBmp = true;36Pesgo1.PeFont.Fixed = true;37 38Pesgo1.PeConfigure.TextShadows = TextShadows.BoldText;41Pesgo1.PeFont.Label.Bold = true;42Pesgo1.PePlot.Option.LineShadows = true;44Pesgo1.PeFont.SizeGlobalCntl = 1.4F;45 46Pesgo1.PeColor.SubsetColors[0] = Color.FromArgb(255, 0, 150, 200);47Pesgo1.PePlot.SubsetLineTypes[0] = LineType.MediumThickSolid;48Pesgo1.PePlot.Method = SGraphPlottingMethod.PointsPlusBestFitCurve;49Pesgo1.PeGrid.Configure.AutoMinMaxPaddingX = 0;50// Not ideal for real-time, but nice for presentation/demonstration51Pesgo1.PePlot.Option.PointGradientStyle = PlotGradientStyle.VerticalAscentInverse;52Pesgo1.PeColor.PointBorderColor = Color.FromArgb(100, 0, 0, 0);53 54Pesgo1.PeConfigure.ImageAdjustLeft = 50;55Pesgo1.PeConfigure.ImageAdjustRight = 0;56 57// Set various export defaults //58Pesgo1.PeSpecial.DpiX = 600;59Pesgo1.PeSpecial.DpiY = 600;60 61Pesgo1.PeConfigure.RenderEngine = RenderEngine.Direct2D;62Pesgo1.PeConfigure.AntiAliasText = true;63Pesgo1.PeConfigure.AntiAliasGraphics = true;64 65Pesgo1.PeFunction.ReinitializeResetImage();66 67// Initialize Counters and Timer //68MainWindow.m_nRealTimeCounter = 1;69MainWindow.m_nSinCounter = 1;70 71MainWindow.Timer1.Interval = 25;72MainWindow.Timer1.Start();73 74/*75/////////////////////////76// Example Timer Event //77/////////////////////////78private void Timer1_Tick(object sender, System.EventArgs e)79{80 float[] newx = { 0.0f };81 float[] newy = { 0.0f };82 83 // New y value and x value //84 newy[0] = (float)(50 + (Math.Sin(m_nSinCounter * 0.075) * 30) + (Rand_Num.NextDouble() * 15));85 newx[0] = m_nRealTimeCounter;86 87 // Append new values //88 Pesgo1.PeData.Y.AppendData(newy, 1);89 Pesgo1.PeData.X.AppendData(newx, 1);90 91 // Increment counter ///92 m_nRealTimeCounter = m_nRealTimeCounter + 1;93 94 // SinCounter is only to produce sin wave data ///95 m_nSinCounter = m_nSinCounter + 1;96 97 if (m_nSinCounter > 30000)98 m_nSinCounter = 1;99 100 // Update image and force paint //101 Pesgo1.PeFunction.ReinitializeResetImage();102 Pesgo1.Refresh();103}104*/Tip: Uses property syntax like
Pego1.PeData.Y[s, p]Click underlined properties to view documentation