Example 103: Scientific Graph showing overlapped multi axes 1
PesgoScientific Graph Objectintermediate
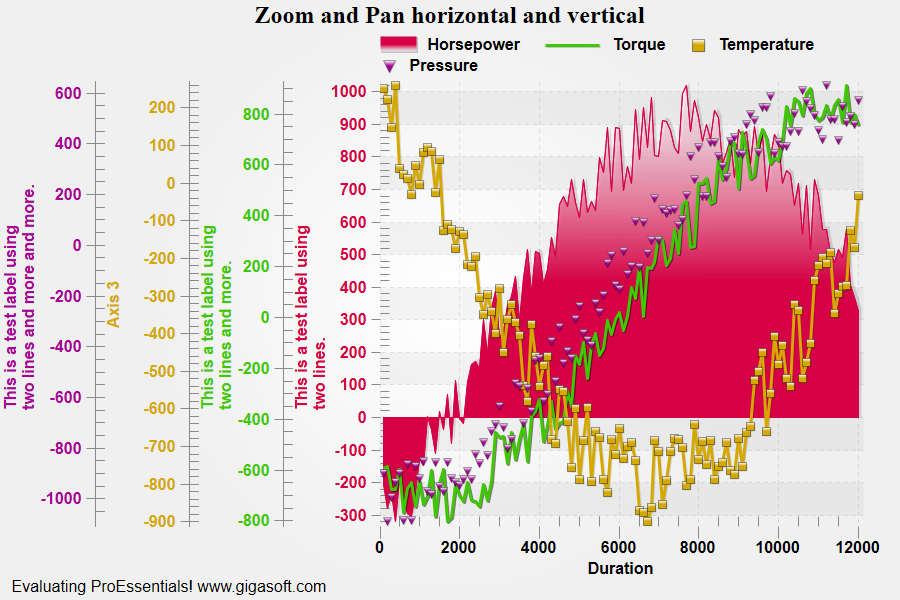
Overlapped multi axes 1
Form3.cs
1//! Try zooming and scrolling vertically. //2 3//! Right button click to show popup menu. //4//! Double Click to show customization dialog. //5//! Left-Click and drag to draw zoom box. Use popup memu or 'z' to undo zoom. //6 7// This example builds upon the basic CreateSimpleSGraph '100' example chart //8CreateSimpleSGraph(Pesgo1);9 10// Create 4 separate axes and then overlap all //11Pesgo1.PeGrid.MultiAxesSubsets[0] = 1; // 1 subset on first axis12Pesgo1.PeGrid.MultiAxesSubsets[1] = 1; // 1 subset on second axis13Pesgo1.PeGrid.MultiAxesSubsets[2] = 1; // 1 subset on third axis14Pesgo1.PeGrid.MultiAxesSubsets[3] = 1; // 1 subset on fourth axis15Pesgo1.PeGrid.OverlapMultiAxes[0] = 4; // overlap all 4 axes in one group16 17//! Set AxisNumberSpacing to 2.0 will create space for two lines.18Pesgo1.PeGrid.Option.AxisNumberSpacing = 2.0;19 20// Match axis color and label to subset label //21Pesgo1.PeGrid.WorkingAxis = 0;22Pesgo1.PeColor.YAxis = Pesgo1.PeColor.SubsetColors[0];23Pesgo1.PeString.YAxisLabel = "This is a test label using \ntwo lines.";24Pesgo1.PePlot.Method = SGraphPlottingMethod.Area;25 26Pesgo1.PeGrid.WorkingAxis = 1;27Pesgo1.PeColor.YAxis = Pesgo1.PeColor.SubsetColors[1];28Pesgo1.PeString.YAxisLabel = "This is a test label using \ntwo lines and more.";29Pesgo1.PePlot.Method = SGraphPlottingMethod.Line;30 31Pesgo1.PeGrid.WorkingAxis = 2;32Pesgo1.PeColor.YAxis = Pesgo1.PeColor.SubsetColors[2];33Pesgo1.PeString.YAxisLabel = "Axis 3";34Pesgo1.PePlot.Method = SGraphPlottingMethod.PointsPlusLine;35 36Pesgo1.PeGrid.WorkingAxis = 3;37Pesgo1.PeColor.YAxis = Pesgo1.PeColor.SubsetColors[3];38Pesgo1.PeString.YAxisLabel = "This is a test label using \ntwo lines and more and more.";39Pesgo1.PePlot.Method = SGraphPlottingMethod.Point;40 41Pesgo1.PeGrid.WorkingAxis = 0;42 43Pesgo1.PeString.TextShadows = TextShadows.NoShadows;44 45// Set Various Other Properties //46Pesgo1.PeColor.BitmapGradientMode = true;47Pesgo1.PeColor.QuickStyle = QuickStyle.LightNoBorder;48Pesgo1.PePlot.MarkDataPoints = false;50Pesgo1.PePlot.DataShadows = DataShadows.Shadows;51Pesgo1.PePlot.Option.SolidLineOverArea = 1;52 53// subset colors //54Pesgo1.PeColor.SubsetColors[0] = MainWindow.DemoColors[0];55Pesgo1.PeColor.SubsetColors[1] = MainWindow.DemoColors[1];56Pesgo1.PeColor.SubsetColors[2] = MainWindow.DemoColors[2];57Pesgo1.PeColor.SubsetColors[3] = MainWindow.DemoColors[3];58 59// subset line types60Pesgo1.PeLegend.SubsetLineTypes[0] = LineType.MediumSolid;61Pesgo1.PeLegend.SubsetLineTypes[1] = LineType.MediumSolid;62Pesgo1.PeLegend.SubsetLineTypes[2] = LineType.MediumSolid;63Pesgo1.PeLegend.SubsetLineTypes[3] = LineType.MediumSolid;64 65Pesgo1.PeUserInterface.Scrollbar.ScrollingHorzZoom = true;66Pesgo1.PeUserInterface.Scrollbar.ScrollingVertZoom = true;67Pesgo1.PeColor.TickColor = Color.FromArgb(0, 1, 0, 0); // Empty equiv Color.Empty;68Pesgo1.PeString.MainTitle = "Zoom and Pan horizontal and vertical";69 70Pesgo1.PeFont.SizeGlobalCntl = 1.3F;71 72// Generally call ReinitializeResetImage at end **'73Pesgo1.PeFunction.ReinitializeResetImage();74Pesgo1.Invalidate();75// Optionally call Pego1.Refresh() if you are not seeing changes immediatelyTip: Uses property syntax like
Pego1.PeData.Y[s, p]Click underlined properties to view documentation