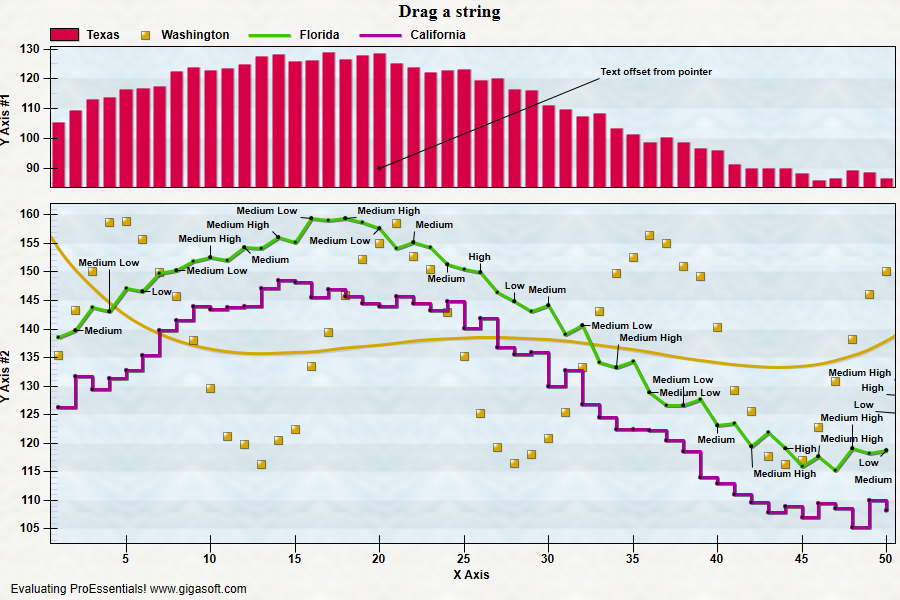
Example 031: Graph showing Subset Obstacles
PegoGraph Objectintermediate
Subset Obstacles
Form2.cs
1//! Note how annotation text does not overlap lines in bottom axes.2//! Left click and drag to zoom chart. Note how text locations change as you zoom.3//! Left click and drag annotation text to move annotation text.4//!5//! This example demonstrates new annotation text positioning logic which prevents all text6//! from overlapping. It also shows how to 1) manually position text with an annotation,7//! 2) allow user to move annotation text, and 3) declare subsets as obstacles so annotation text8//! doesn't overlap subsets. It also ahows how to change the default location where9//! annotation text is automatically positioned.10 11// Pass Data12Pego1.PeData.Subsets = 4;13Pego1.PeData.Points = 100;14 15Boolean bAddAnnot;16int nCount, p;17String[] szs = new String[5];18szs[0] = "High";19szs[1] = "Medium High";20szs[2] = "Medium";21szs[3] = "Medium Low";22szs[4] = "Low";23 24bAddAnnot = false;25nCount = 0;26for(p = 0; p <= 99; p++)27{28 Pego1.PeData.Y[0, p] = (float)(105.0F + (20 * Math.Sin(0.1 * p)) + (5 * Rand_Num.NextDouble()));29 Pego1.PeData.Y[1, p] = (float)(105.0F + (20 * Math.Sin(0.1 * p)) + (5 * Rand_Num.NextDouble()) + 30);30 Pego1.PeData.Y[2, p] = (float)(105.0F + (20 * Math.Sin(0.4 * p)) + (5 * Rand_Num.NextDouble()) + 30);31 Pego1.PeData.Y[3, p] = (float)(105.0F + (20 * Math.Sin(0.1 * p)) + (5 * Rand_Num.NextDouble()) + 20);32 33 if(bAddAnnot)34 {35 Pego1.PeAnnotation.Graph.X[nCount] = p + 1;37 38 Pego1.PeAnnotation.Graph.Text[nCount] = szs[Convert.ToInt32(Rand_Num.NextDouble() * 4.5)];39 Pego1.PeAnnotation.Graph.Type[nCount] = (int) GraphAnnotationType.Pointer;40 Pego1.PeAnnotation.Graph.Axis[nCount] = 1;41 42 nCount = nCount + 1;43 }44 bAddAnnot = !bAddAnnot;45}46 47// The following code manully places annotation text at separate coordinates than annotation. //48// GraphAnnotationText has |H special justifation code which signifies that coordinates follow. //49// Note that coordinates are split and terminated with pipe symbol. //50Pego1.PeAnnotation.Graph.X[nCount] = 20;51Pego1.PeAnnotation.Graph.Y[nCount] = 90;52Pego1.PeAnnotation.Graph.Text[nCount] = "|H33.0|120.0|Text offset from pointer";53Pego1.PeAnnotation.Graph.Type[nCount] = Convert.ToInt32(GraphAnnotationType.Pointer);54 55// Set Plotting Methods per Subset //56Pego1.PePlot.Methods[0] = GraphPlottingMethods.Bar;57Pego1.PePlot.Methods[1] = GraphPlottingMethods.Line;58Pego1.PePlot.Methods[2] = GraphPlottingMethods.PointsPlusBestFitCurveGraphed;59Pego1.PePlot.Methods[3] = GraphPlottingMethods.Step;60Pego1.PePlot.Option.BestFitDegree = BestFitDegree.Fourth;61 62// Designate 2nd, 3rd, and 4th subset as obstacles //63Pego1.PeAnnotation.Graph.SubsetObstacles[0] = false;64Pego1.PeAnnotation.Graph.SubsetObstacles[1] = true;65Pego1.PeAnnotation.Graph.SubsetObstacles[2] = true;66Pego1.PeAnnotation.Graph.SubsetObstacles[3] = true;67 68// This code replaces the first default text location attempted for automatic text placement //69// Setting to 270 causes text to be centered above annotation location if no obstacle is found //70Pego1.PeAnnotation.Graph.TextLocation[0] = 270;71 72// Show annotations and allow graph hot spots and moveable annotation text //73Pego1.PeAnnotation.Show = true;74Pego1.PeUserInterface.HotSpot.GraphAnnotation = AnnotationHotSpot.GraphOnly;75Pego1.PeAnnotation.Graph.Moveable = Convert.ToBoolean(GraphAnnotMoveable.Pointer);76 77// Split up subsets among different axes //78Pego1.PeGrid.MultiAxesSubsets[0] = 1;79Pego1.PeGrid.MultiAxesSubsets[1] = 3;80Pego1.PeGrid.MultiAxesProportions[0] = 0.3F;81Pego1.PeGrid.MultiAxesProportions[1] = 0.7F;82 83Pego1.PeString.MainTitle = "Drag a string";84Pego1.PeString.SubTitle = "";85Pego1.PeUserInterface.Allow.FocalRect = false;86Pego1.PeGrid.LineControl = GridLineControl.None;87Pego1.PeUserInterface.Allow.Zooming = AllowZooming.Horizontal;88Pego1.PeUserInterface.Allow.ZoomStyle = ZoomStyle.Ro2Not;89 90// Subset labels //91Pego1.PeString.SubsetLabels[0] = "Texas";92Pego1.PeString.SubsetLabels[1] = "Florida";93Pego1.PeString.SubsetLabels[2] = "Washington";94Pego1.PeString.SubsetLabels[3] = "California";95 96// Subset colors //97Pego1.PeColor.SubsetColors[0] = MainWindow.DemoColors[0];98Pego1.PeColor.SubsetColors[1] = MainWindow.DemoColors[1];99Pego1.PeColor.SubsetColors[2] = MainWindow.DemoColors[2];100Pego1.PeColor.SubsetColors[3] = MainWindow.DemoColors[3];101 102// Subset line types //103Pego1.PeLegend.SubsetLineTypes[0] = LineType.MediumSolid;104Pego1.PeLegend.SubsetLineTypes[1] = LineType.MediumSolid;105Pego1.PeLegend.SubsetLineTypes[2] = LineType.MediumSolid;106Pego1.PeLegend.SubsetLineTypes[3] = LineType.MediumSolid;107 108// Various other features //109Pego1.PeFont.Fixed = true;110Pego1.PeColor.BitmapGradientMode = true;111Pego1.PeColor.QuickStyle = QuickStyle.LightLine;112Pego1.PeLegend.SimplePoint = true;113Pego1.PeLegend.SimpleLine = true;114Pego1.PeLegend.Style = LegendStyle.OneLine;115 116Pego1.PeFont.GraphAnnotationTextSize = 85;117Pego1.PeUserInterface.Menu.AnnotationControl = true;118Pego1.PePlot.MarkDataPoints = true;119Pego1.PeGrid.Option.MultiAxisStyle = MultiAxisStyle.SeparateAxes;120Pego1.PeUserInterface.Menu.MultiAxisStyle = MenuControl.Show;121Pego1.PeUserInterface.Menu.LegendLocation = MenuControl.Show;122Pego1.PePlot.Allow.Step = true;123Pego1.PePlot.DataShadows = DataShadows.Shadows;124 125Pego1.PePlot.Option.GradientBars = 8;126Pego1.PeConfigure.TextShadows = TextShadows.BoldText;129Pego1.PeFont.Label.Bold = true;130Pego1.PePlot.Option.LineShadows = true;132Pego1.PeUserInterface.Scrollbar.PointsToGraph = 50;133 134Pego1.PePlot.Option.PointGradientStyle = PlotGradientStyle.RadialTopLeft;135Pego1.PeColor.PointBorderColor = Color.FromArgb(100, 0, 0, 0);136Pego1.PePlot.Option.LineSymbolThickness = 3;137Pego1.PePlot.Option.AreaBorder = 1;138 139// Set various export defaults //140Pego1.PeSpecial.DpiX = 600;141Pego1.PeSpecial.DpiY = 600;142 143// default export setting //144Pego1.PeUserInterface.Dialog.ExportSizeDef = ExportSizeDef.NoSizeOrPixel;145Pego1.PeUserInterface.Dialog.ExportTypeDef = ExportTypeDef.Png;146Pego1.PeUserInterface.Dialog.ExportDestDef = ExportDestDef.Clipboard;147Pego1.PeUserInterface.Dialog.ExportUnitXDef = "1280";148Pego1.PeUserInterface.Dialog.ExportUnitYDef = "768";149Pego1.PeUserInterface.Dialog.ExportImageDpi = 300;150 151Pego1.PeUserInterface.Cursor.PromptTracking = true;152Pego1.PeUserInterface.Cursor.PromptLocation = CursorPromptLocation.ToolTip;153Pego1.PeUserInterface.Cursor.PromptStyle = CursorPromptStyle.XYValues;154 155Pego1.PeConfigure.RenderEngine = RenderEngine.Direct2D;156Pego1.PeConfigure.AntiAliasGraphics = true;157Pego1.PeConfigure.AntiAliasText = true;158 159Pego1.PeFunction.ReinitializeResetImage();160Pego1.Invalidate();161// Optionally call Pego1.Refresh() if you are not seeing changes immediatelyTip: Uses property syntax like
Pego1.PeData.Y[s, p]Click underlined properties to view documentation