JavaScript チャートライブラリ
ネイティブ C++ エンジンを WebAssembly にコンパイルした JavaScript チャートライブラリ


ProEssentialsJS is a JavaScript charting library built on the same native C++ engine that has driven ProEssentials on Windows since 1993, compiled to WebAssembly and drawing through Canvas2D and WebGPU. It is the web member of a family that also covers WinUI, WPF, WinForms, C++/MFC, Delphi and ActiveX, so a chart configured on one platform configures the same way on the others.
Add it to a page
Two script tags and no build toolchain. The engine is one classic script, your own code is a module. There is no bundler step, no transpile step and no framework requirement.
npm install proessentials
The JavaScript chart walkthrough takes it from install to a live real time chart, step by step.
Licensing
Nothing in commercial charting is this permissive. Organizations under $250,000 USD annual revenue use ProEssentialsJS free, commercially, with redistribution included. Not a trial, not a community edition, and not limited to non commercial use.
Above that, the licence is perpetual and royalty free, with unlimited applications, websites, servers and end users. No licence key, no watermark, no feature gates, no registration and no phone home. The version you buy is yours to ship for as long as you ship it.
Personal projects, study and hobby use are free without time limit, and teaching, coursework and academic research are free at any institution revenue.
How that compares against every other free tier, open source and commercial, is on best free JavaScript chart.
Pricing and the full licence agreement.
See it running
Three live demos run the real engine in the browser, with no sign up and nothing to install:
- JavaScript chart demo, the example browser
- Real time JavaScript chart demo
- JavaScript 3D surface chart demo, on WebGPU
Source for each is on GitHub, and the JavaScript chart examples page lists every example with its code.
How it compares
Three pages rather than one, so each can go into proper depth:
- WebAssembly charting engine, which libraries ship wasm, with measured sizes and links to verify them
- JavaScript chart comparison, licensing, pricing, deployment and API surface
- Fastest JavaScript chart, performance with the measurement conditions stated
Documentation
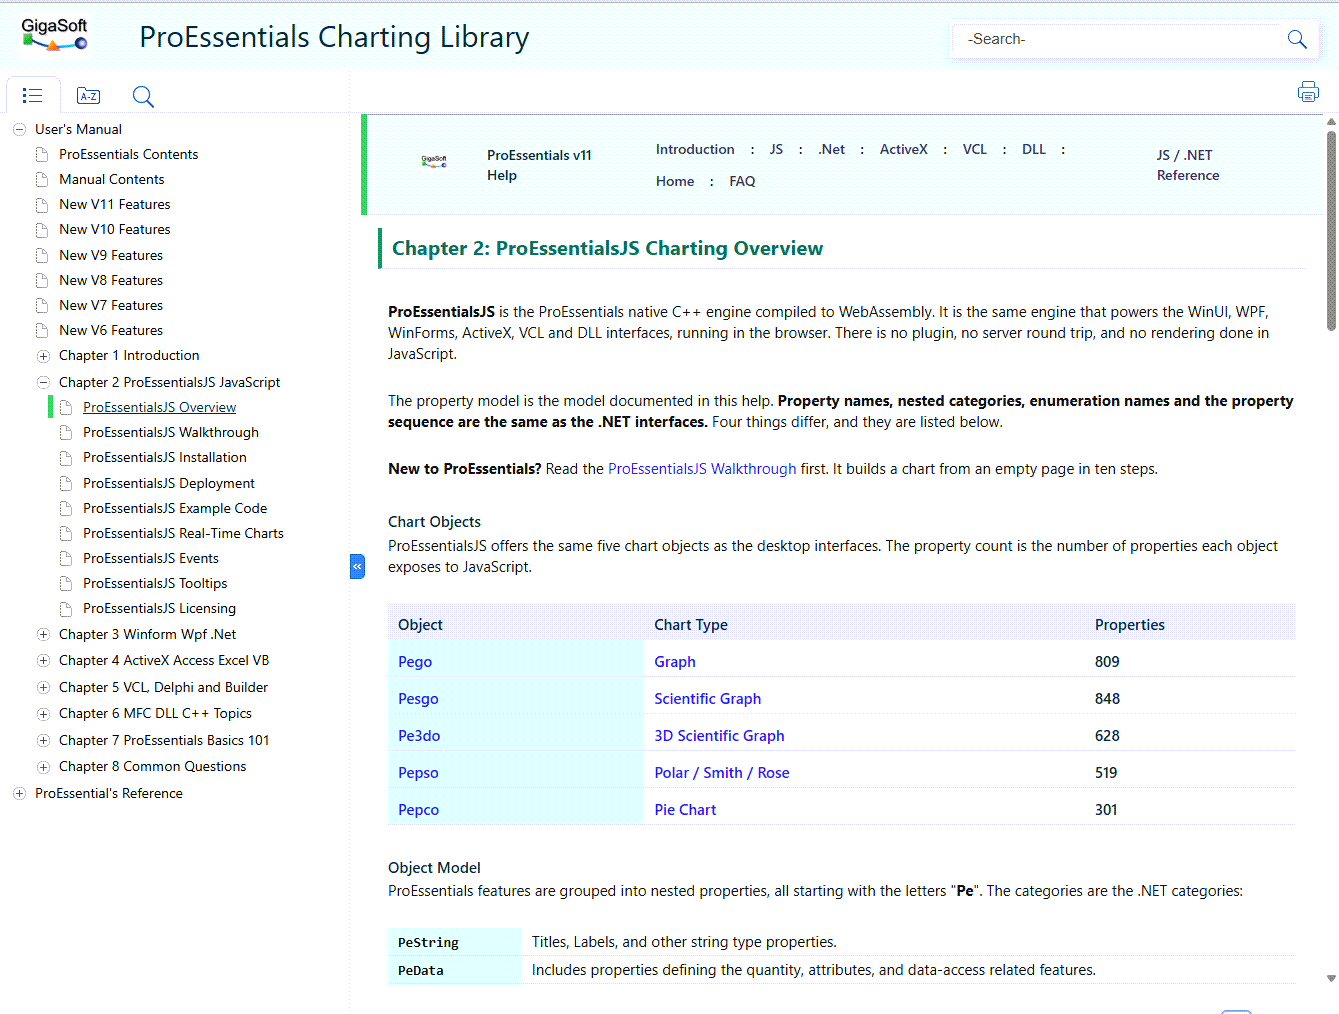
The ProEssentialsJS overview sits inside the same online reference as every other interface, because it is the same property model.
- ProEssentialsJS overview, in the online reference
- Walkthrough, install to a live chart
- Examples, every demo with its source
AI writes the code
pe_query.py ships with v11 and fully supports JavaScript development. It validates every property path against the compiled engine, so an assistant cannot invent an API that does not exist.
The knowledge base carries a dedicated JavaScript file alongside the tooling instructions and core knowledge. The JavaScript code is nearly identical to the .NET code, because the facades are generated from the same data pe_query.py reads. Look a property up once, and it is correct on every interface.
It ships in the v11 setup, and it is also a public repository, so an assistant can read it without installing anything.
- AI Code Assistant, what it is and how to use it
- proessentials-ai-data on GitHub
Localization
Menus and dialogs ship in 20 cultures, including both Simplified and Traditional Chinese, and the library loads the one it needs at run time. Nothing to download, install or register. Details are on the international languages page.
Chart types
Line, scatter, bar, area, pie, polar and Smith charts, plus 3D surface and contour rendering on WebGPU. Scientific, financial and real time work are the cases the engine was built for. Multiple Y axes, log scales, date time axes, annotations, cursors, zooming and hit testing are engine features rather than add-ons.
Your users can change the chart
Right click any chart and the engine offers its own menu. Not a toolbar someone has to build, and not a feature that has to be wired up. It is part of the control, it is localized into the same 20 cultures, and the end user drives it:
- Switch to monochrome, or monochrome with symbols, for a report or a black and white printer
- Change the plotting method, point type, line type and shading style, on the fly
- Add a data table under the Pego chart, show or hide annotations
- Mark data points, bold the grid, add a title, and adjust colors and fonts
- Export and print, WYSIWYG, with export size, print options and a font size slider
These are not web features. They are engine features that have been in ProEssentials since long before the browser was a target, and they came across with the engine when it was compiled to WebAssembly.